Risk
Desk
Size With Edge
Professional position sizing, ADR stop levels, trade analytics and journaling — in one elegant tool built for serious traders.

-Badge-Logo.wine.svg)

Professional position sizing, ADR stop levels, trade analytics and journaling — in one elegant tool built for serious traders.
Every feature exists to help you make better decisions before, during, and after the trade.
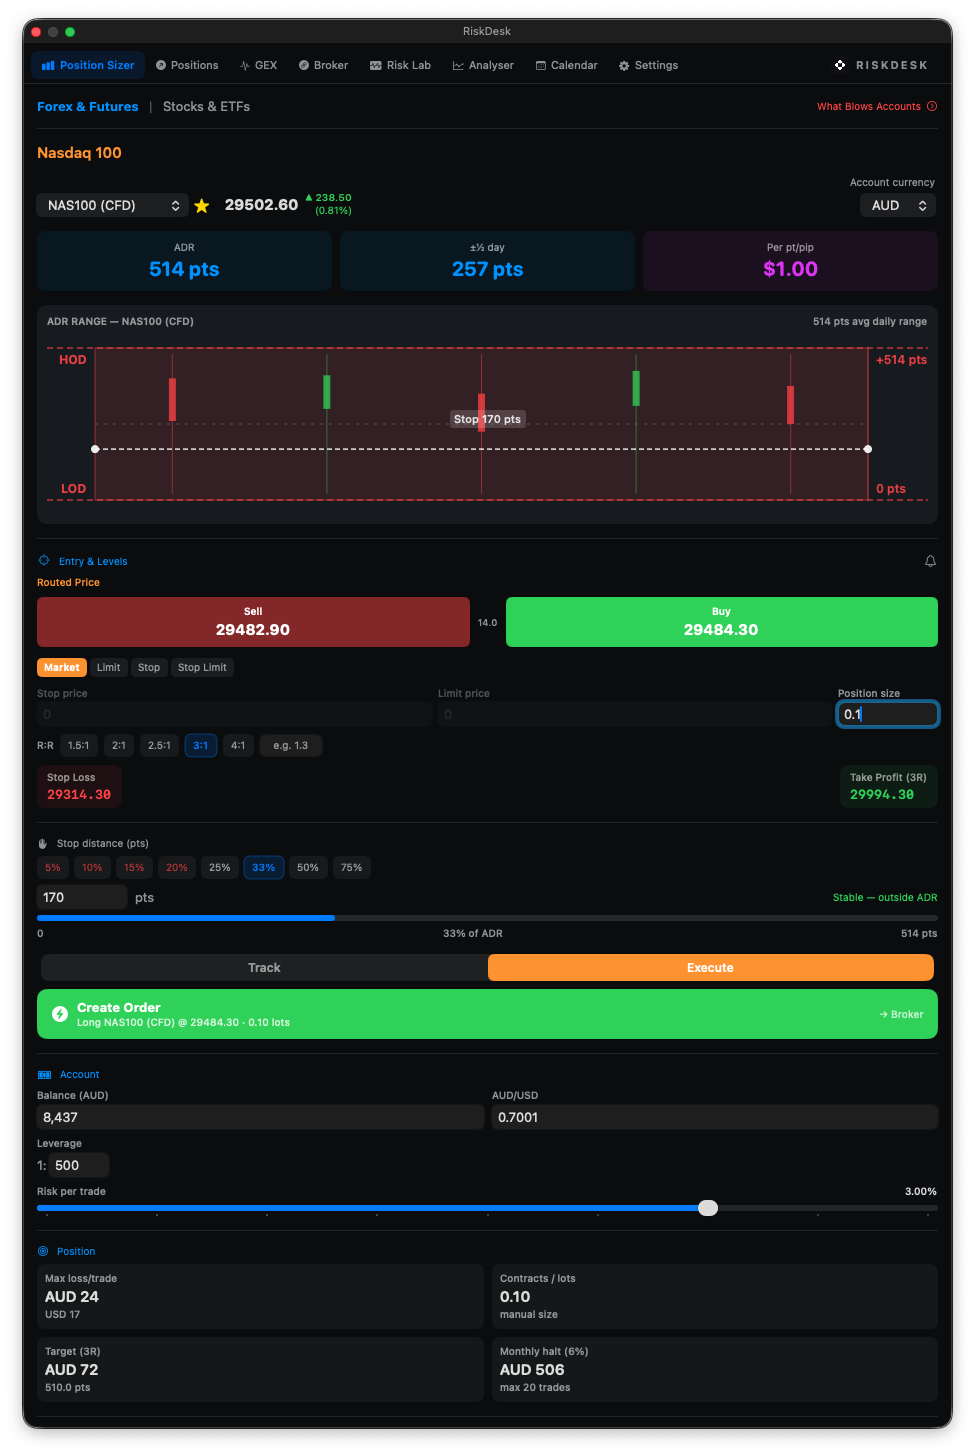
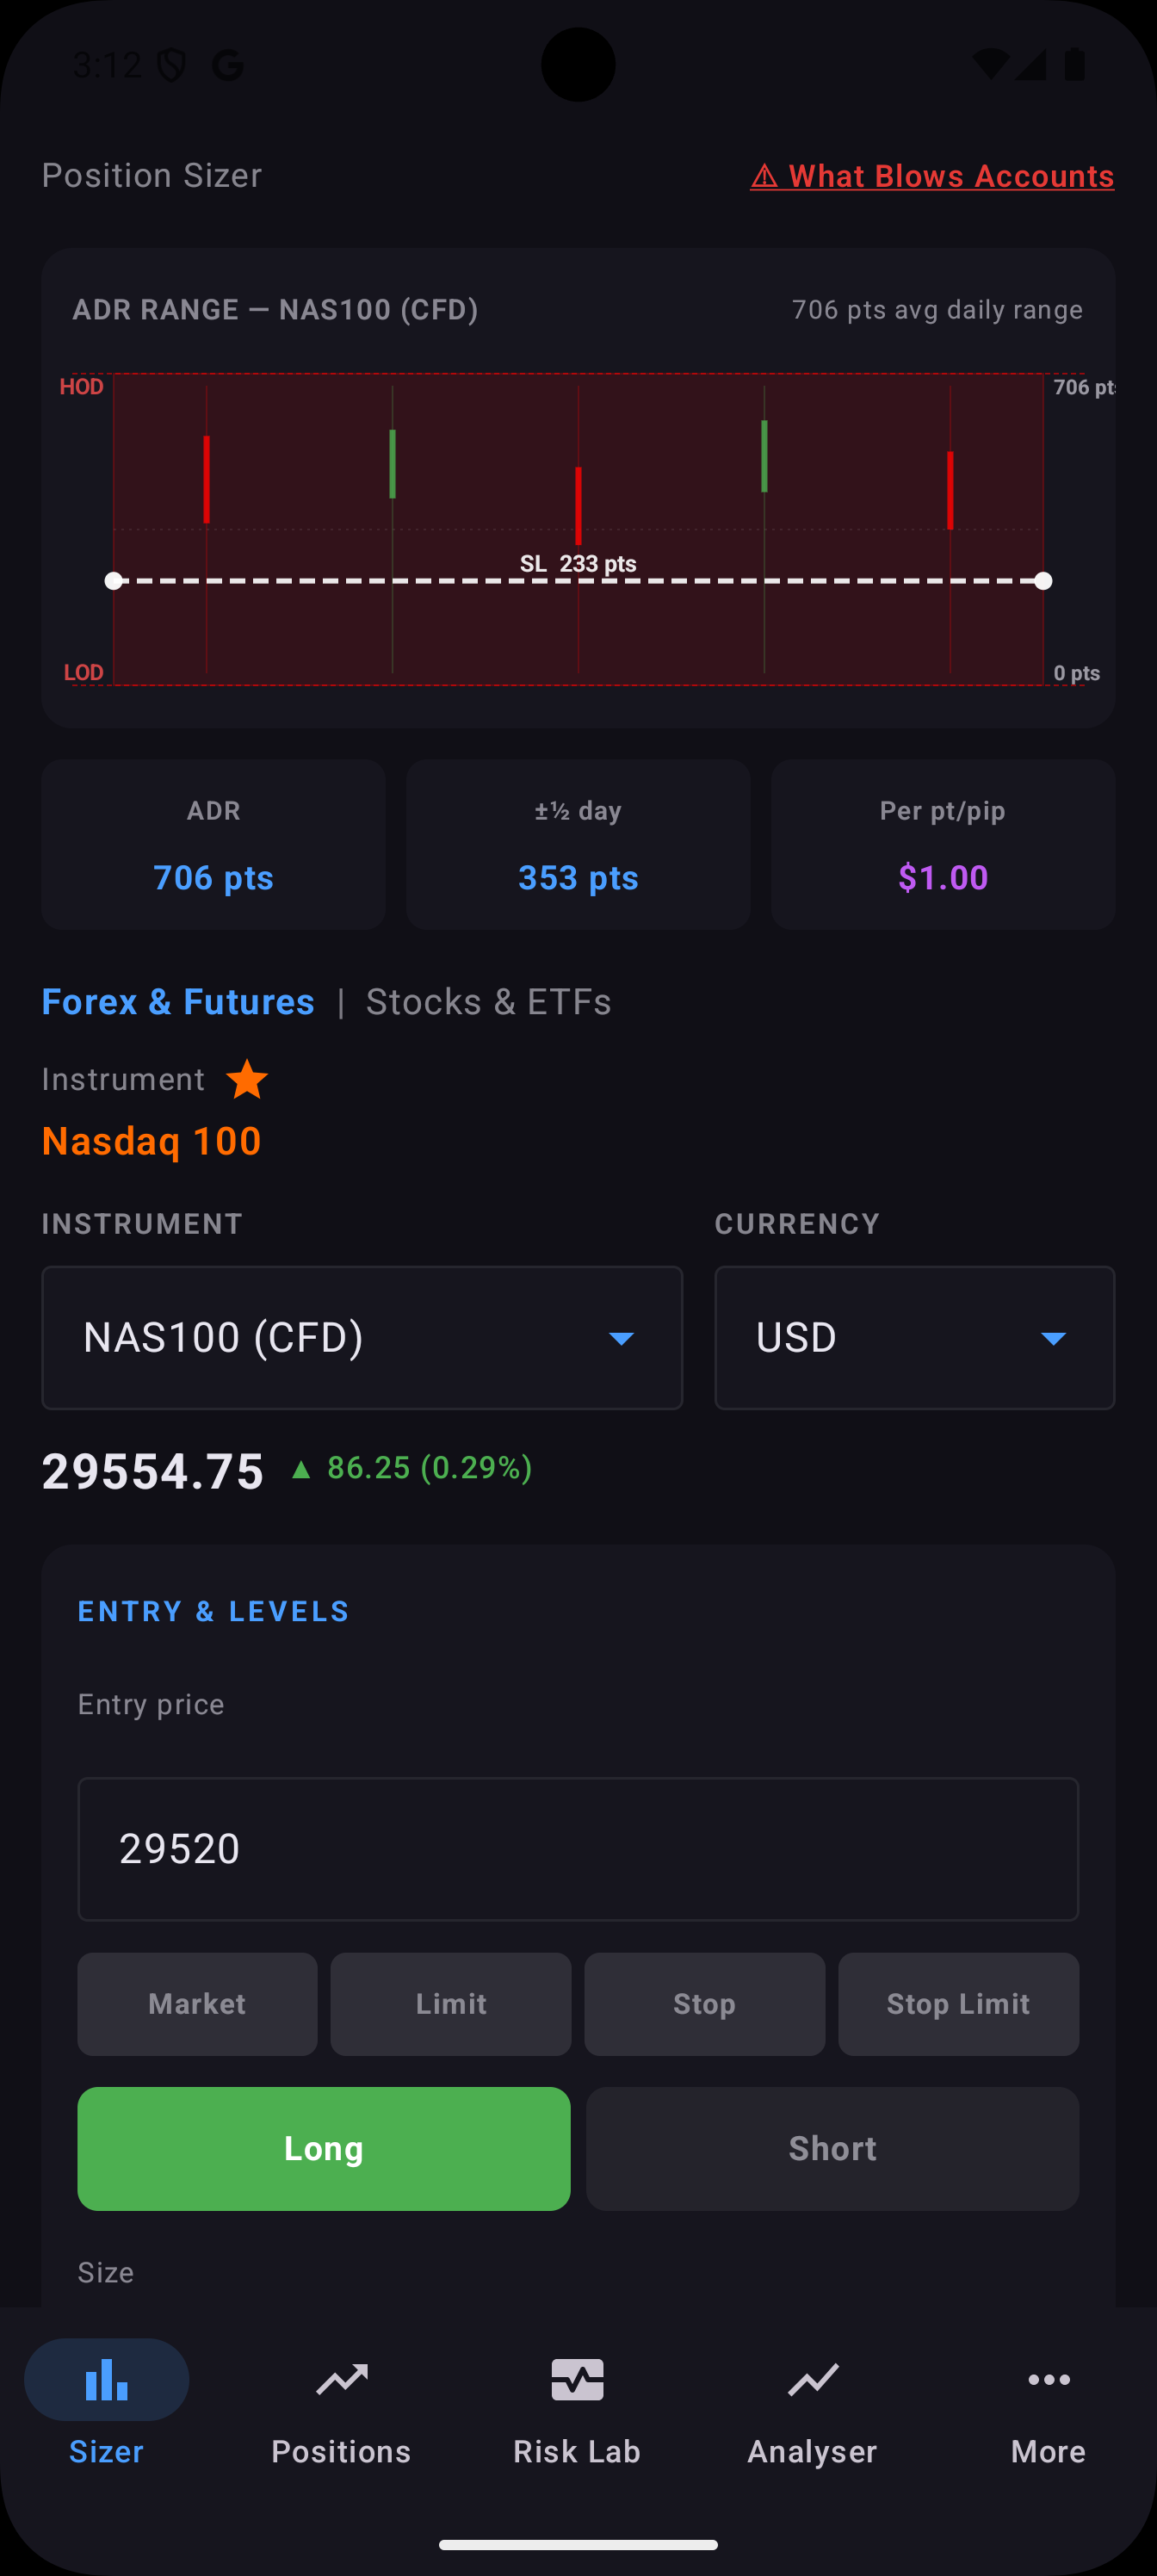
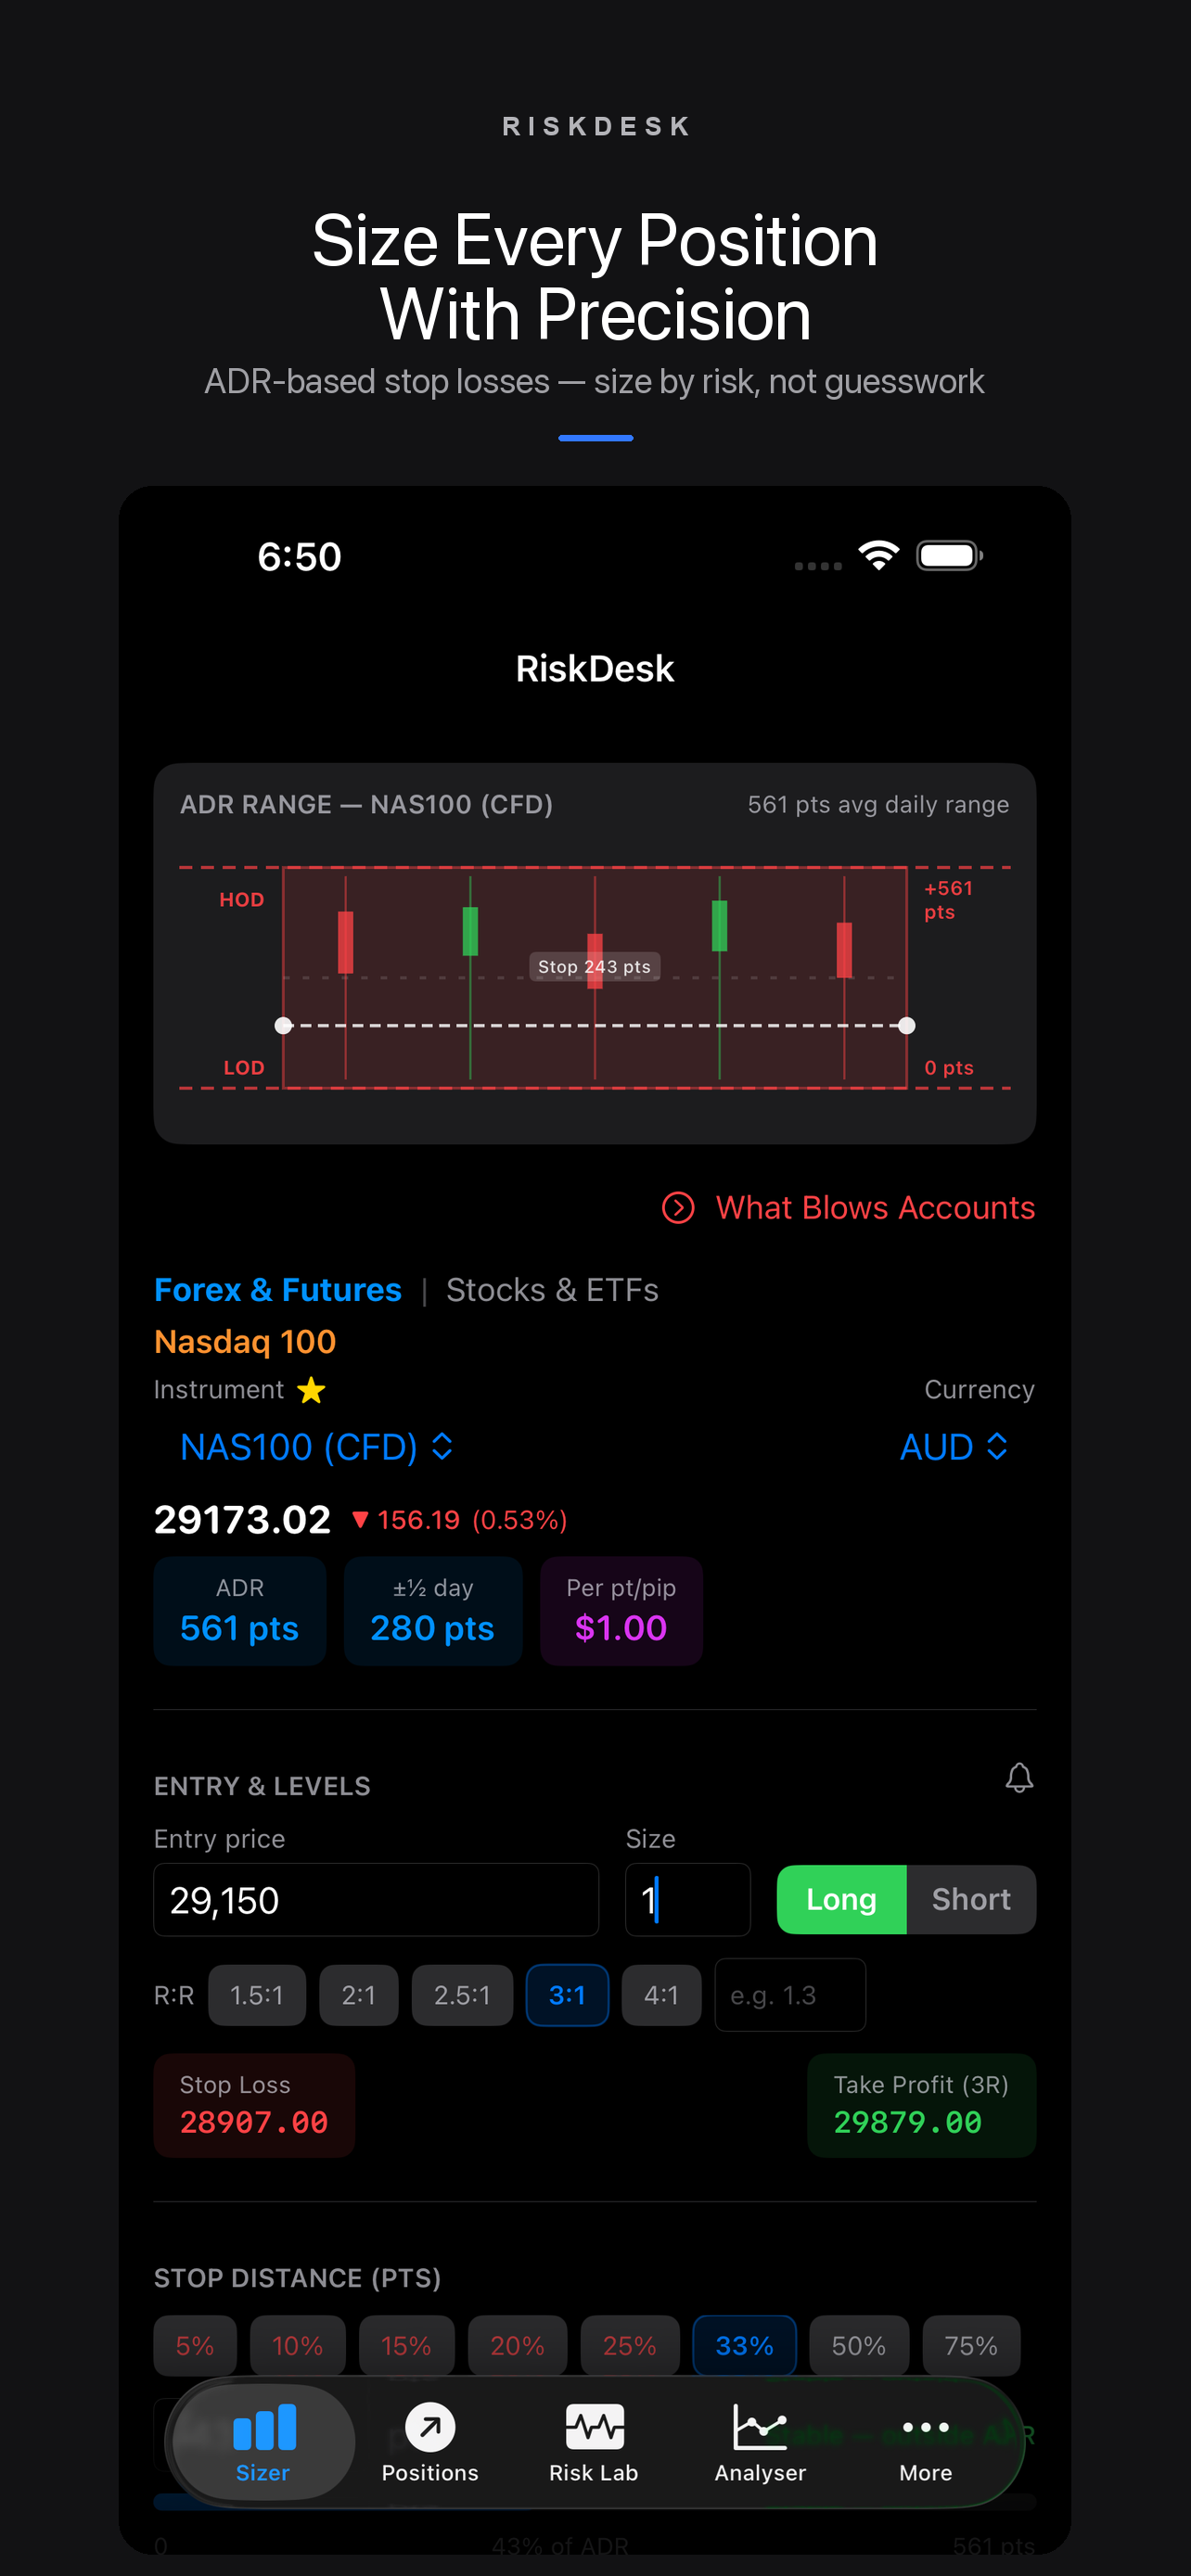
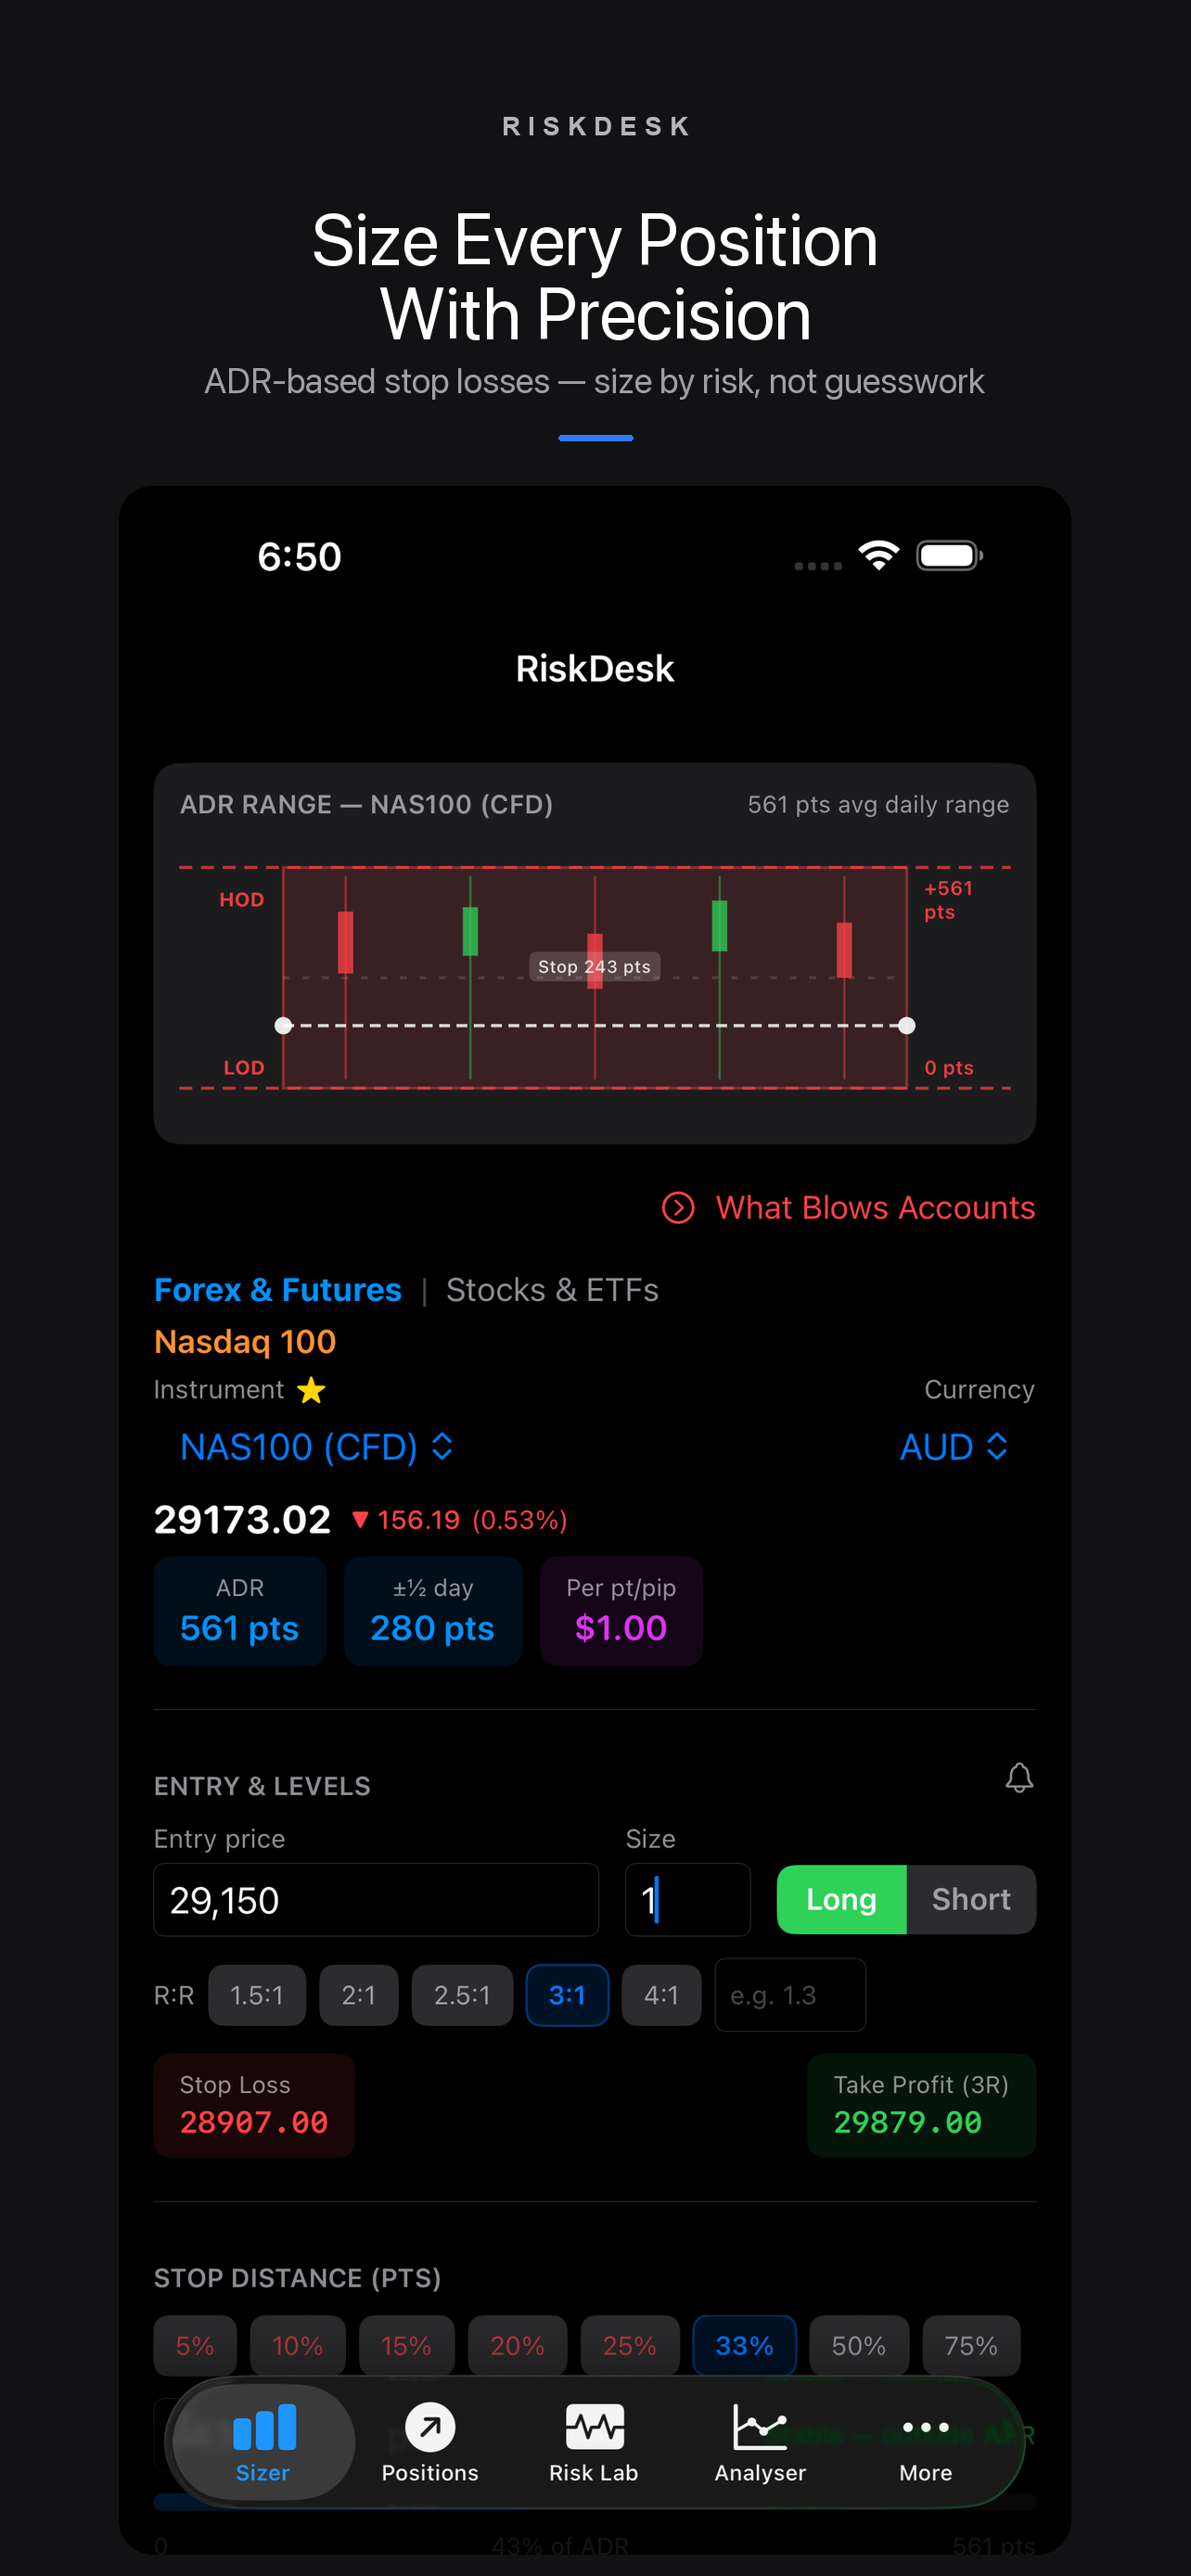
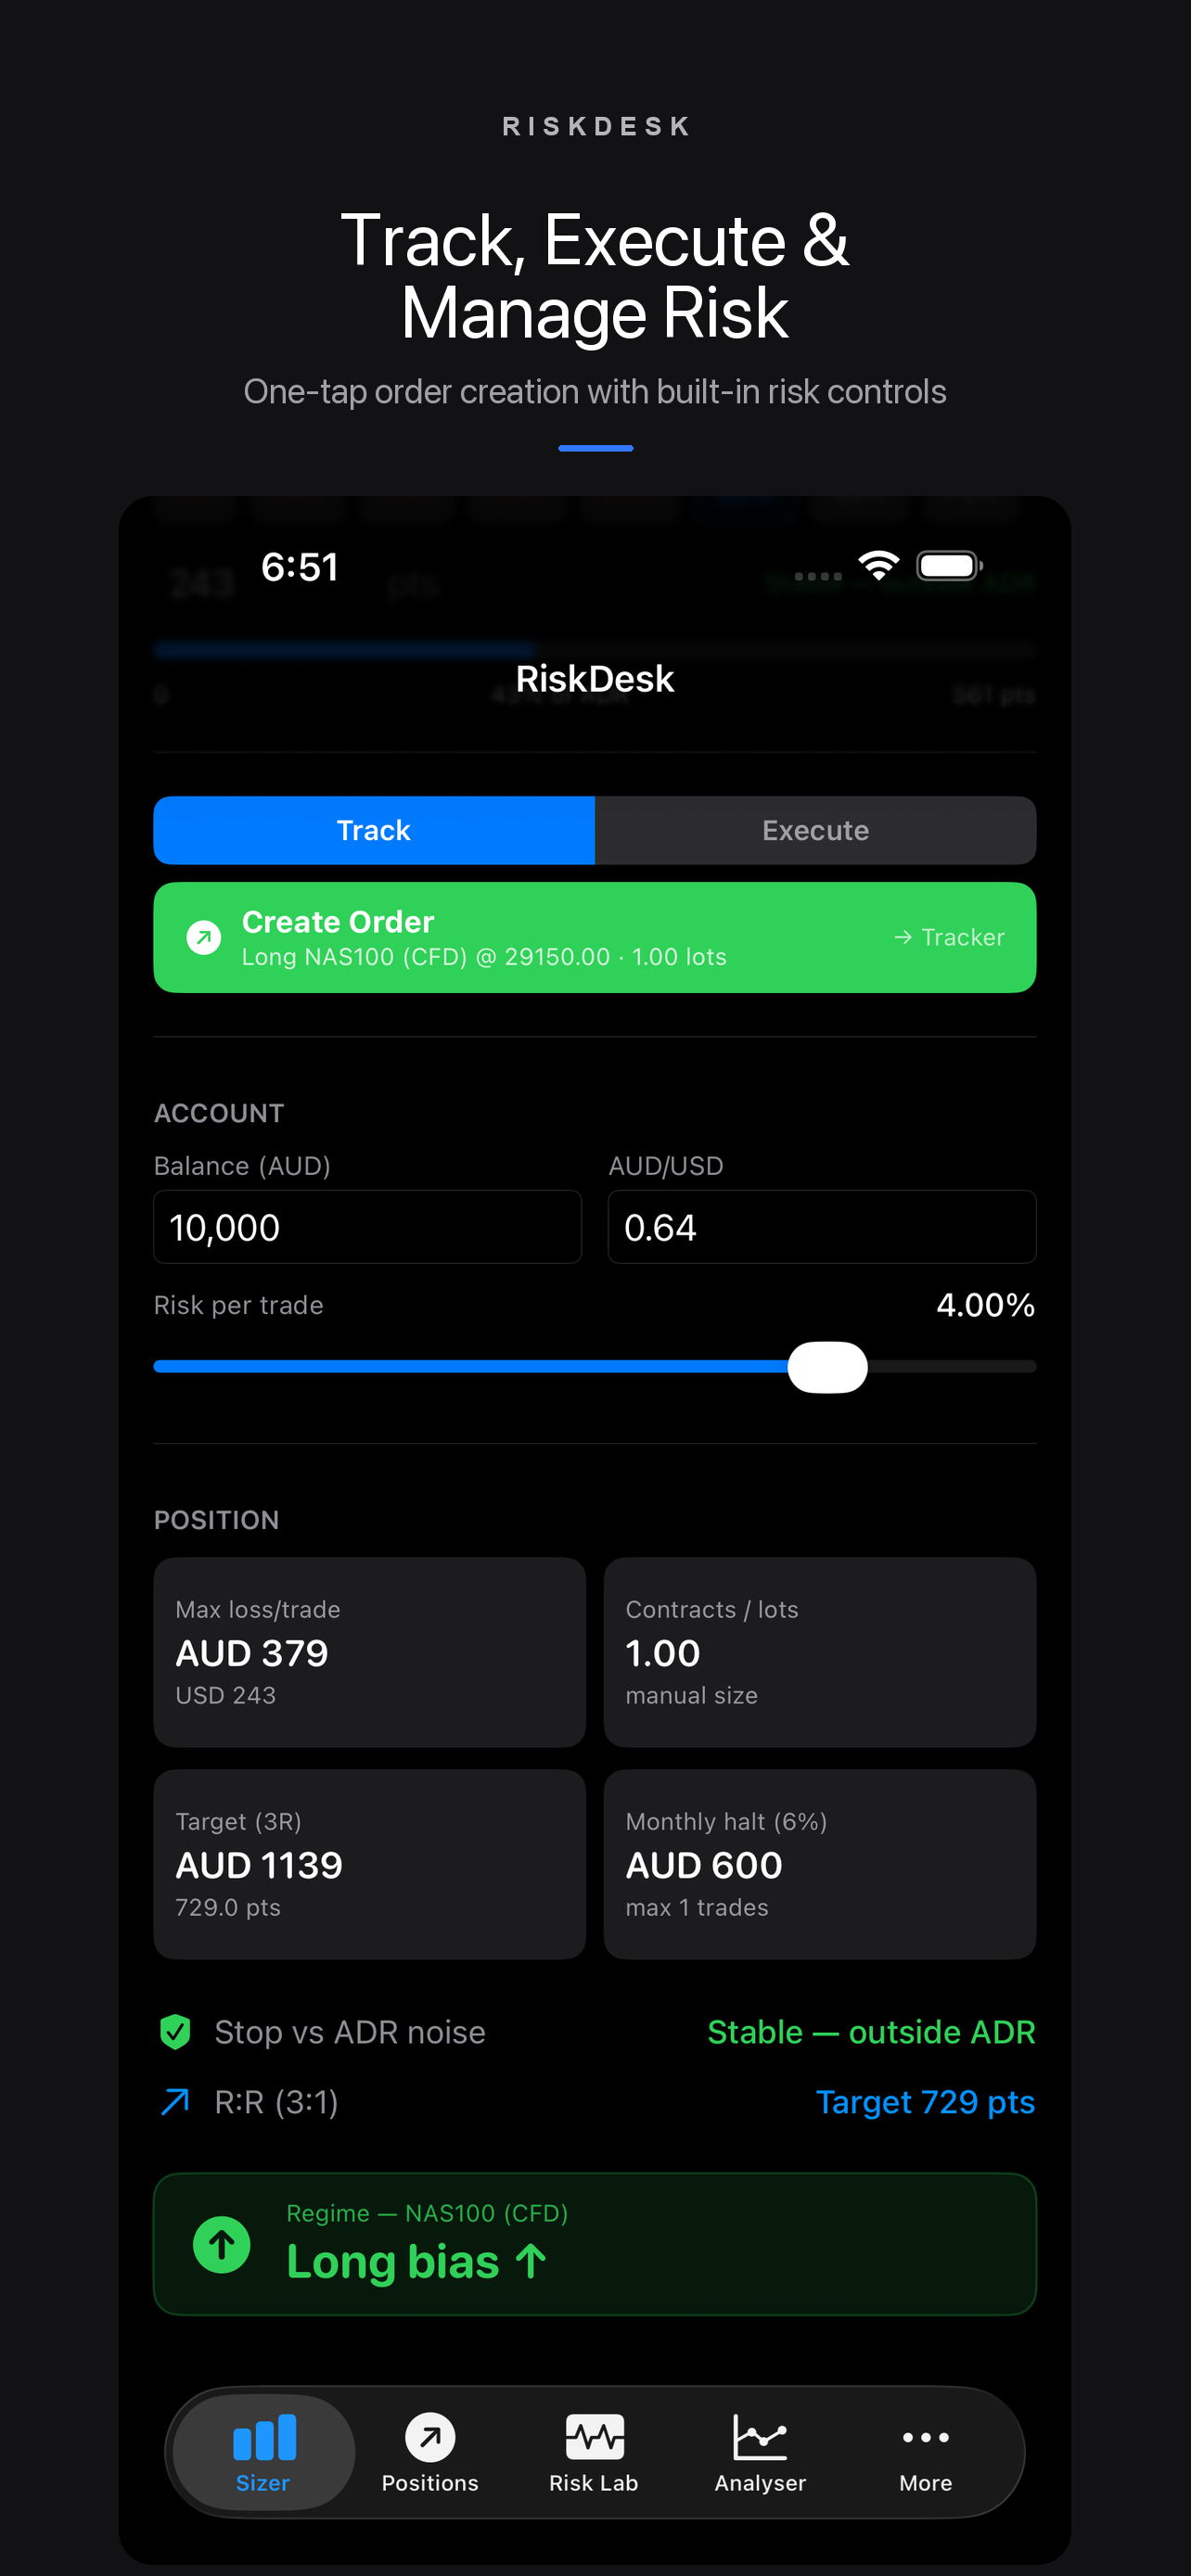
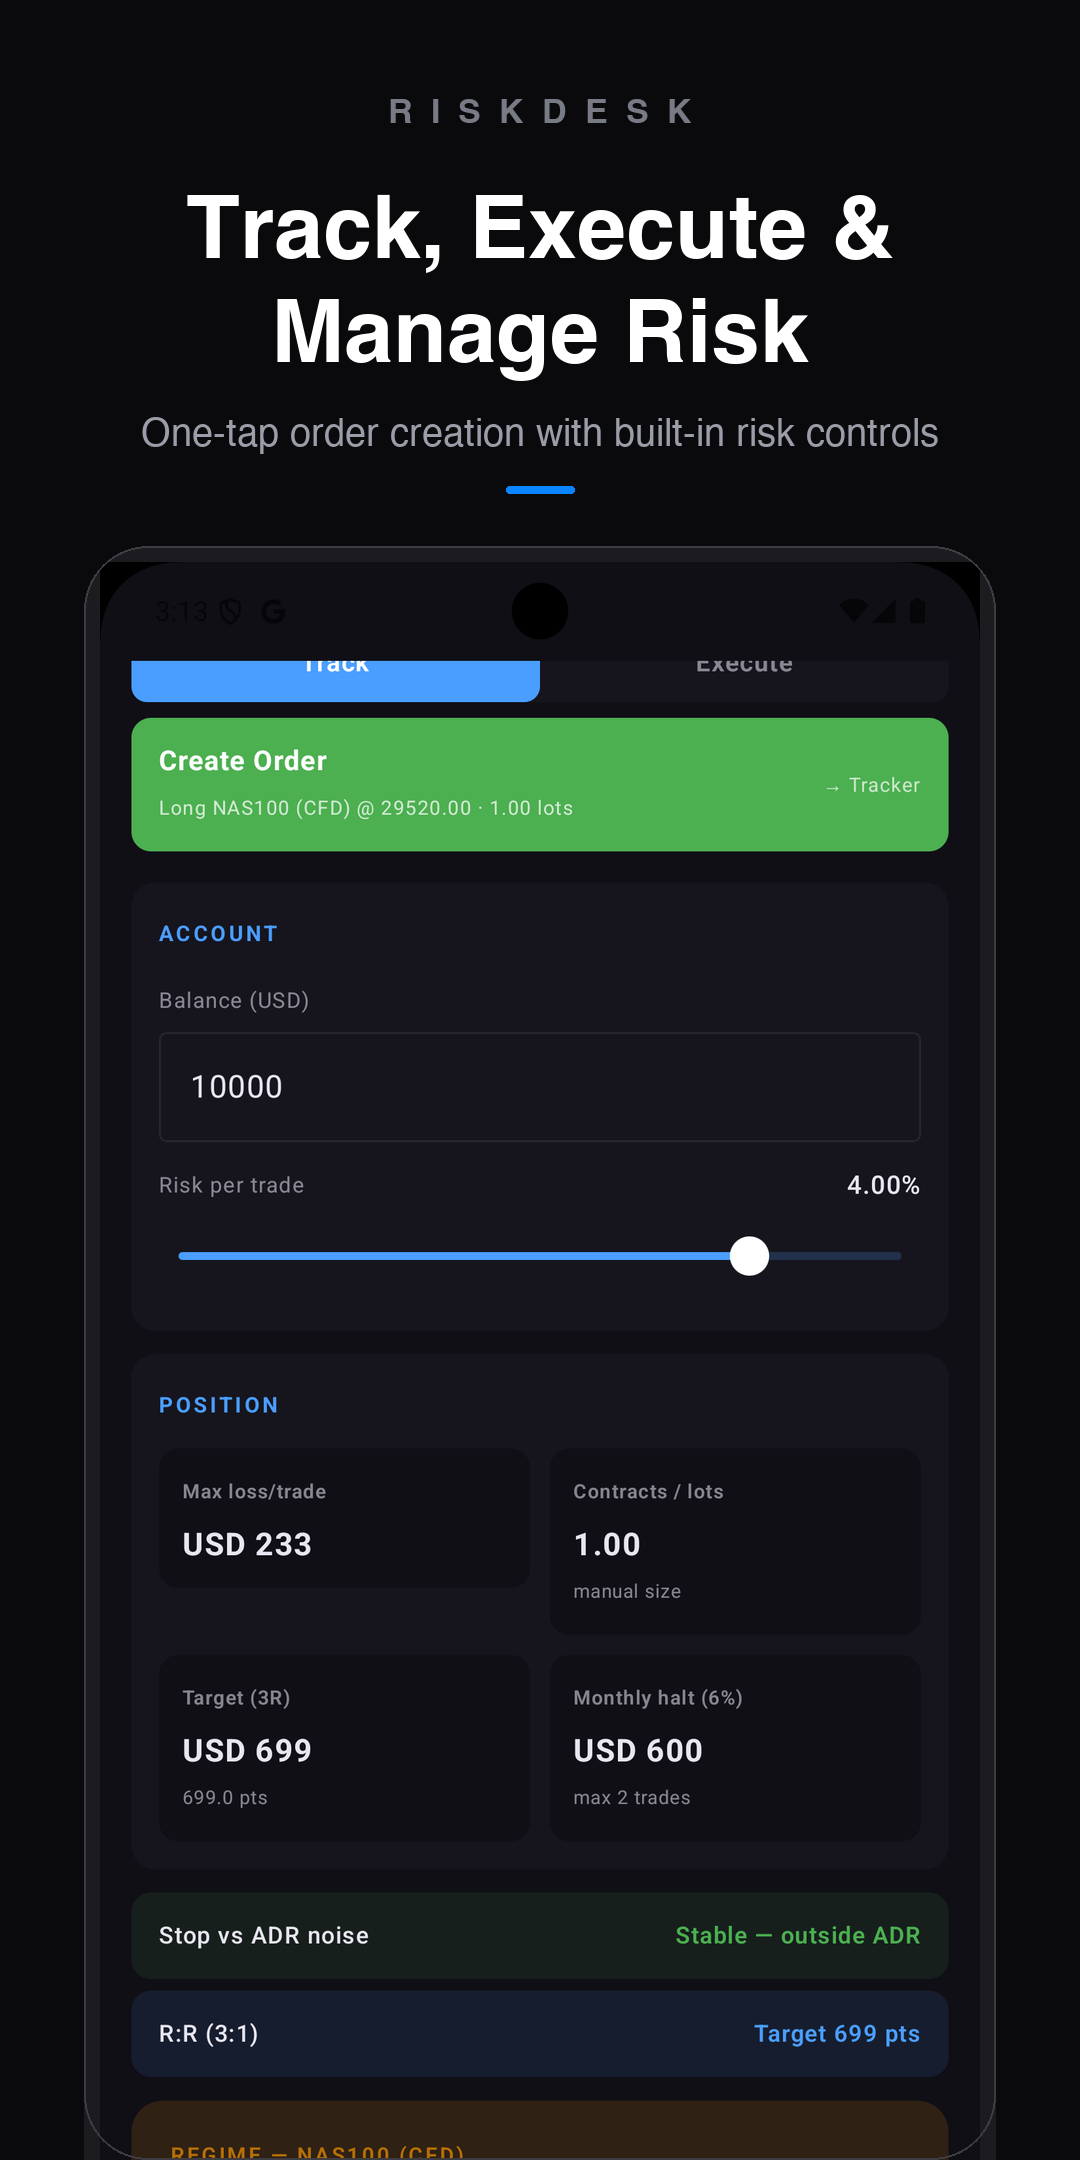
Calculate your ideal position size using live Average Daily Range data. Know your risk in dollars before you enter any trade.
Monte Carlo over 4,000 paths per cell. Solves the largest risk per trade whose worst-case drawdown still fits your tolerance — and tells you the odds of passing an evaluation at that size.
Buckets your own trade history by market state, setup, hold time, day and hour, so you can see which conditions actually pay you and which ones you only think do.
47 plans with their real rules — drawdown type, daily limits, consistency, minimum days — ranked by Trader's Edge: expected payout per dollar of fee.
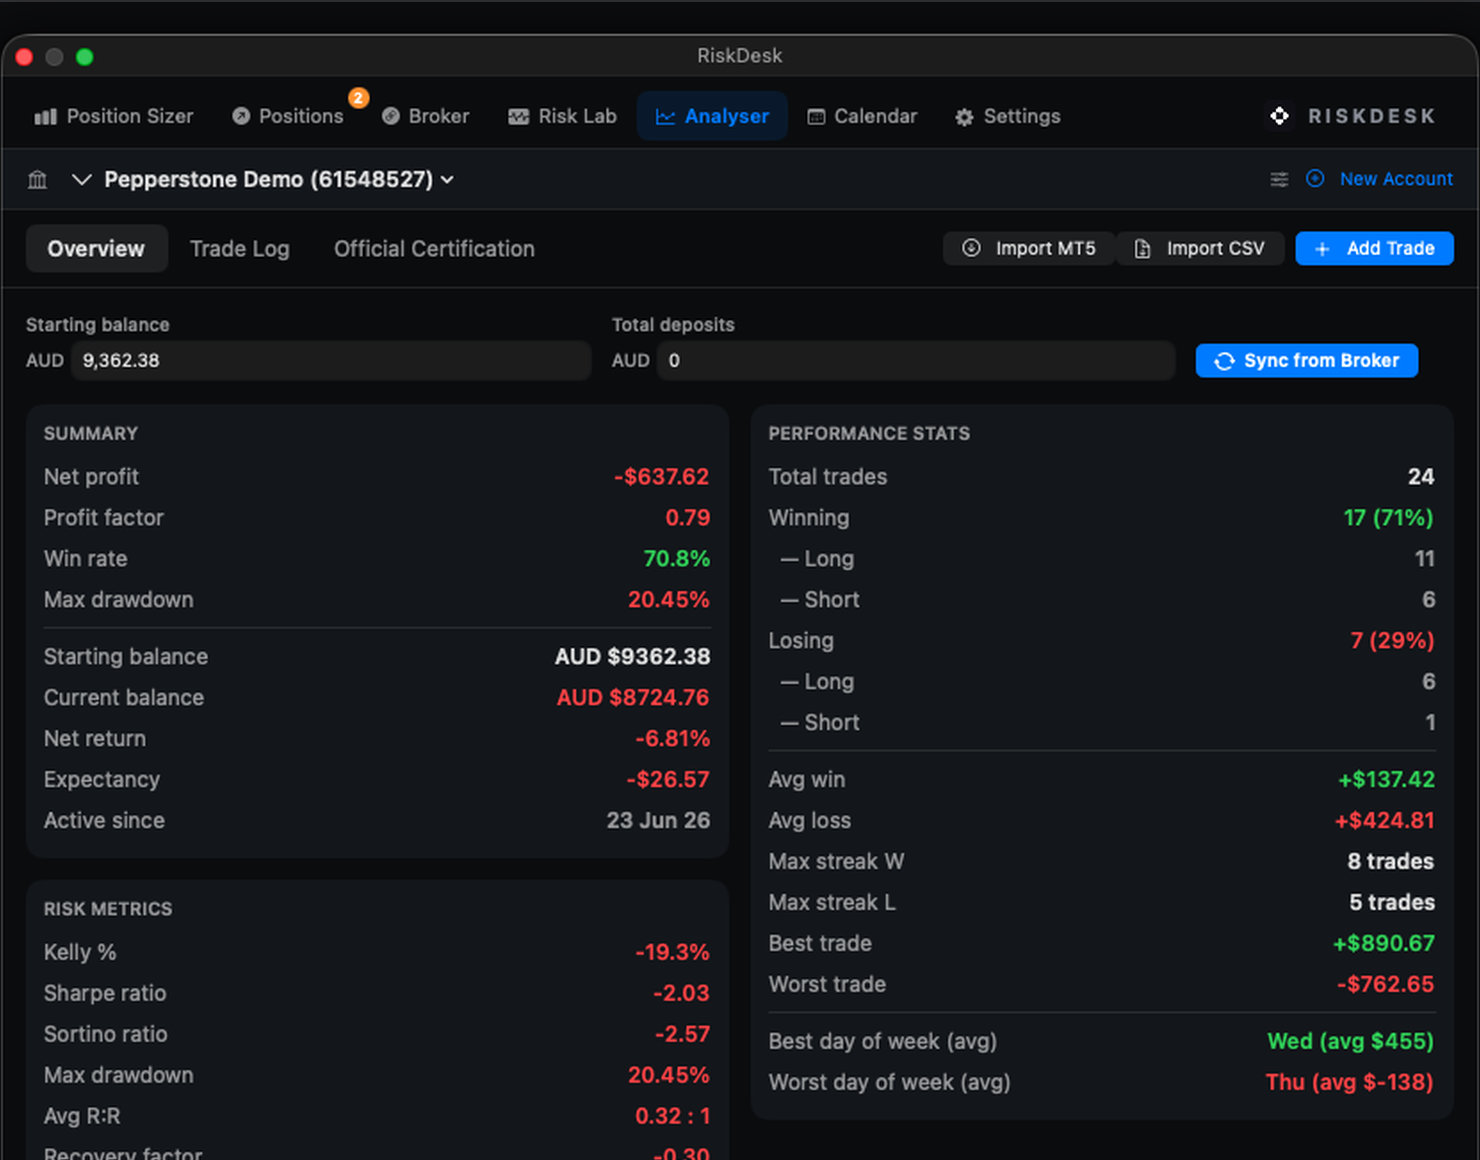
Equity curve, win rate, profit factor, Sharpe ratio, max drawdown. Import broker CSVs or log trades manually.
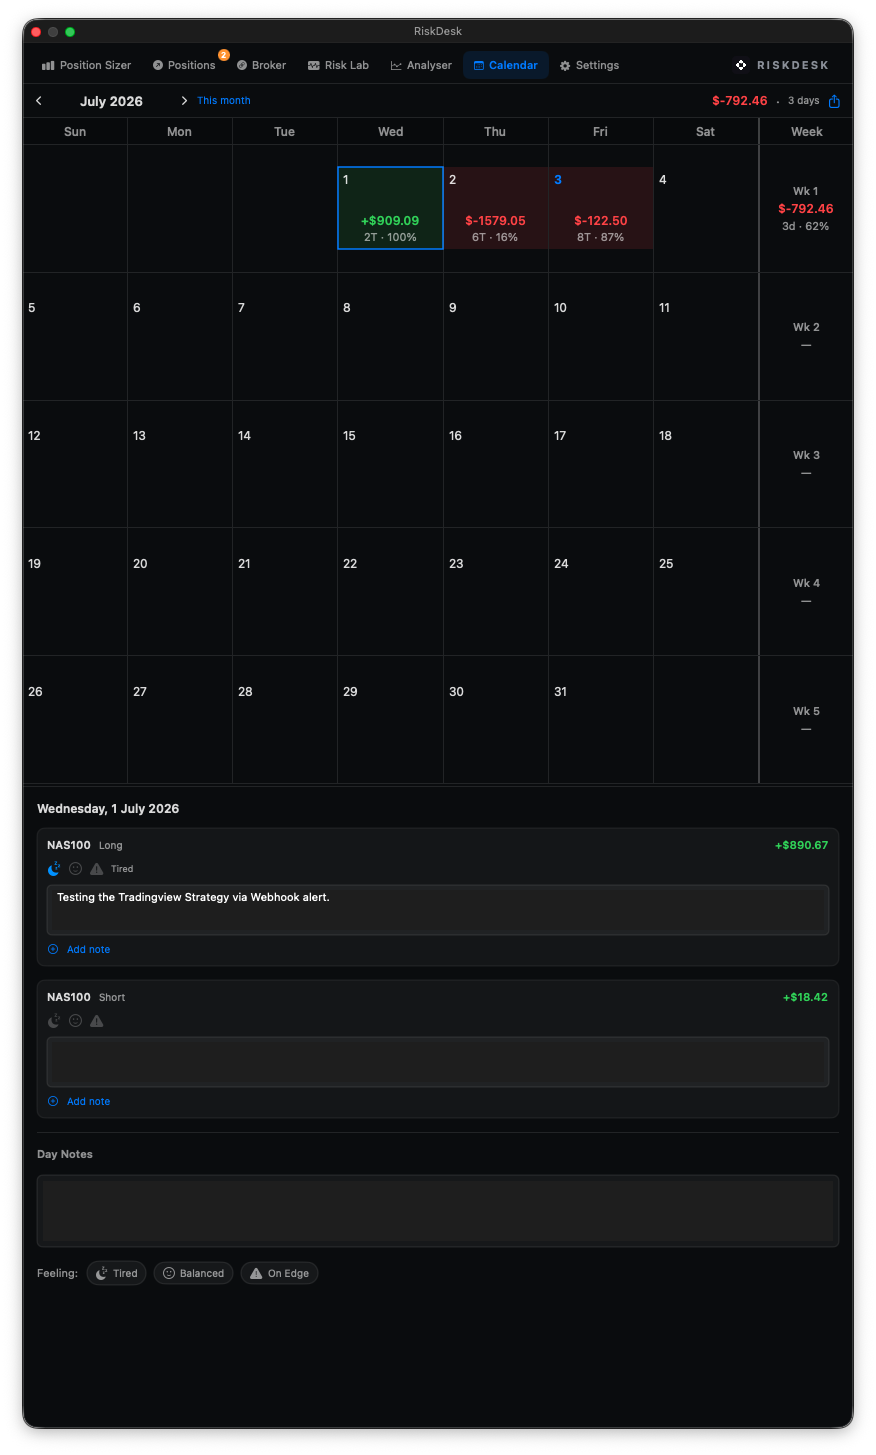
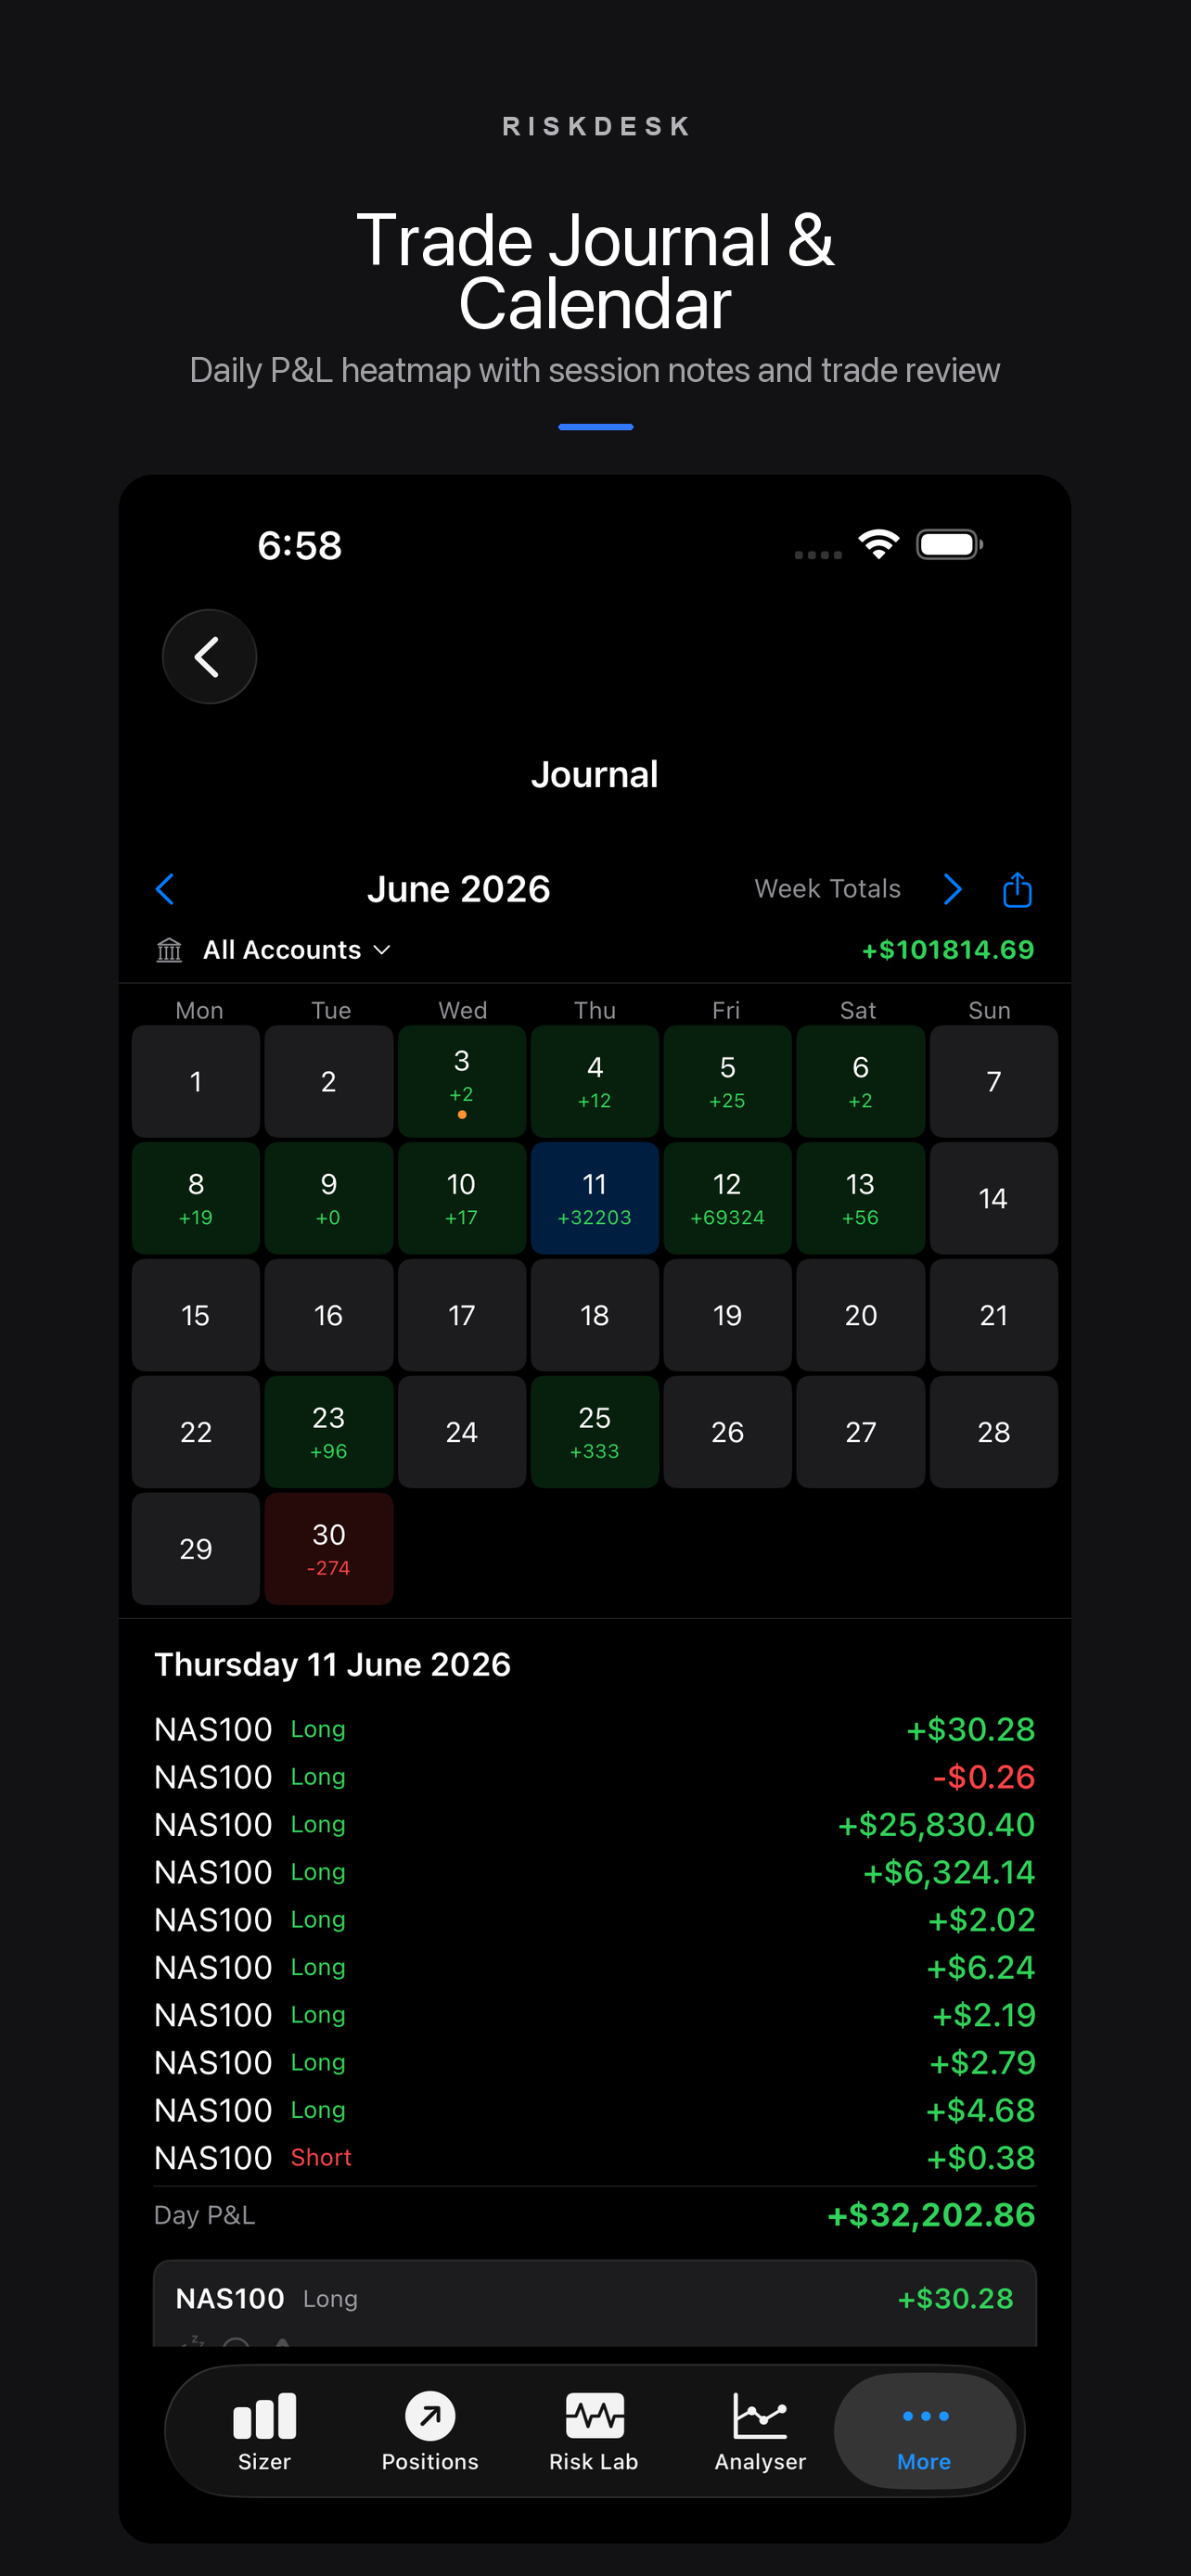
Calendar view of every trading day with P&L, notes, and emotional state. Week Totals overlay reveals weekly patterns.
Track multiple trading accounts across brokers. Import CSV data per account to keep performance separated.
RiskDesk floats above your charts — always visible while you trade, across every Space and full-screen app.
Built-in best-practice rules plus your own personal rulebook. Keep your strategy visible and discipline sharp.
Export all your data to JSON and save to iCloud Drive, Google Drive, or locally. Restore any time with one tap.
Set your account's base currency and RiskDesk automatically converts risk amounts and P&L into your preferred currency.
No account needed. Your journal, accounts and settings live on your device. Only the optional cloud features, Smart Shield, broker connections and webhooks, use a server.
Most traders pick a position size and hope. RiskDesk runs 4,000 Monte Carlo paths per cell against your win rate, your reward:risk and your drawdown tolerance, then solves for the largest fixed risk whose 95th-percentile drawdown still fits inside that tolerance.
| Risk / trade | 0.5R | 1R | 1.5R | 2R | 3R |
|---|---|---|---|---|---|
| 4.00%$2,000/trade | 11.7%5 trades | 23.4%7 trades | 42.4%8 trades | 48.7%7 trades | 56.2%6 trades |
| 3.00%$1,500/trade | 18.5%8 trades | 39.5%9 trades | 58.0%8 trades | 65.6%7 trades | 75.8%6 trades |
| 2.00%$1,000/trade | 14.0%9 trades | 43.8%9 trades | 65.4%8 trades | 71.8%7 trades | 83.4%6 trades |
| 1.50%$750/trade | 12.4%17 trades | 54.1%11 trades | 72.7%9 trades | 80.3%7 trades | 85.6%6 trades |
| 1.00%$500/trade | 6.5%33 trades | 67.2%16 trades | 86.7%10 trades | 91.4%9 trades | 95.8%7 trades |
| 0.50%$250/trade | 0.6%99 trades | 87.9%46 trades | 98.2%22 trades | 99.5%14 trades | 99.8%9 trades |
| 0.25%$125/trade | 0.0%— trades | 99.2%108 trades | 100.0%44 trades | 100.0%29 trades | 100.0%16 trades |
Hypothetical Performance Disclosure: The figures in this section are simulated. Hypothetical performance results have many inherent limitations, some of which are described below. No representation is being made that any account will or is likely to achieve profits or losses similar to those shown; in fact, there are frequently sharp differences between hypothetical performance results and the actual results subsequently achieved by any particular trading program. One of the limitations of hypothetical performance results is that they are generally prepared with the benefit of hindsight. In addition, hypothetical trading does not involve financial risk, and no hypothetical trading record can completely account for the impact of financial risk of actual trading. For example, the ability to withstand losses or to adhere to a particular trading program in spite of trading losses are material points which can also adversely affect actual trading results. There are numerous other factors related to the markets in general or to the implementation of any specific trading program which cannot be fully accounted for in the preparation of hypothetical performance results, and all of which can adversely affect trading results.
Your trade history knows which conditions pay you. The Edge Optimiser buckets every trade by the market state it was taken in and the setup you took, then reports win rate, per-trade expectancy, net P&L and count for each bucket — so the answer comes from your own results rather than your memory of them.
| Setup | Trend ↑ | Trend ↓ | T.Range ↑ | T.Range ↓ | Consol ↔ |
|---|---|---|---|---|---|
| Continuationwith the move | 62%34 trades | 58%26 trades | 55%18 trades | 53%15 trades | 38%41 trades |
| Reversalagainst it | 41%17 trades | 44%12 trades | 57%14 trades | 67%3 trades | 61%20 trades |
Hypothetical Performance Disclosure: The figures in this section are simulated. Hypothetical performance results have many inherent limitations, some of which are described below. No representation is being made that any account will or is likely to achieve profits or losses similar to those shown; in fact, there are frequently sharp differences between hypothetical performance results and the actual results subsequently achieved by any particular trading program. One of the limitations of hypothetical performance results is that they are generally prepared with the benefit of hindsight. In addition, hypothetical trading does not involve financial risk, and no hypothetical trading record can completely account for the impact of financial risk of actual trading. For example, the ability to withstand losses or to adhere to a particular trading program in spite of trading losses are material points which can also adversely affect actual trading results. There are numerous other factors related to the markets in general or to the implementation of any specific trading program which cannot be fully accounted for in the preparation of hypothetical performance results, and all of which can adversely affect trading results.
47 prop firm evaluation plans with the rules they really run — drawdown type, daily limits, consistency, minimum days — ranked by expected payout per dollar of fee. It measures the rules, not the firm, and it shows you the traps before you pay for one.
| Account | Target | Max DD | PT:DD | DD type | Cost | Edge | Pass |
|---|---|---|---|---|---|---|---|
| TradeifySelect · $300K | $14,000 | $8,000 | 175% | Trailing | $349 | 23.2× | 64% |
| FTMO1-Step · $100K | $10,000 | $10,000 | 100% | Trail to B/E | $399 | 20.9× | 93% |
| FuturesEliteNitro · $150K | $9,000 | $4,500 | 200% | Trail to B/E | $298 | 19.6× | 72% |
| FuturesEliteNitro · $100K | $6,000 | $3,000 | 200% | Trail to B/E | $218 | 17.9× | 72% |
| FTMO2-Step P1 · $100K | $10,000 | $10,000 | 100% | Static | $439 | 17.3× | 95% |
| Alpha CapitalPro 10% P1 · $100K | $10,000 | $10,000 | 100% | Static | $447 | 17.0× | 95% |
| Alpha CapitalPro 10% P1 · $200K | $20,000 | $20,000 | 100% | Static | $897 | 17.0× | 95% |
| FTMO1-Step · $200K | $20,000 | $20,000 | 100% | Trail to B/E | $999 | 16.7× | 93% |
Hypothetical Performance Disclosure: The figures in this section are simulated. Hypothetical performance results have many inherent limitations, some of which are described below. No representation is being made that any account will or is likely to achieve profits or losses similar to those shown; in fact, there are frequently sharp differences between hypothetical performance results and the actual results subsequently achieved by any particular trading program. One of the limitations of hypothetical performance results is that they are generally prepared with the benefit of hindsight. In addition, hypothetical trading does not involve financial risk, and no hypothetical trading record can completely account for the impact of financial risk of actual trading. For example, the ability to withstand losses or to adhere to a particular trading program in spite of trading losses are material points which can also adversely affect actual trading results. There are numerous other factors related to the markets in general or to the implementation of any specific trading program which cannot be fully accounted for in the preparation of hypothetical performance results, and all of which can adversely affect trading results.
Profitability, Edge and the evaluation ranking, as they actually look on a Mac. Click any one to see it full size.
 Pass Probability Matrix
 Edge Optimiser
 Equity Curve & Outcomes
 Drawdown & Risk of Ruin
 Win Rate vs Reward:Risk
 Trader's Edge
 Safe Position Size
Trade copier, prop accounts, evaluation ranking, edge and journal on the Mac. Click any one to see it full size.
 Trade Copier
 Prop Firm Accounts
 Choose An Evaluation
 Evaluation Rules
 Pass Probability
 Size From Win Rate
 Prop Trading As A Business
 Edge Optimiser
 Edge Confidence
 MFE Targets
 Journal
 Simulation
 Projection
 Risk Of Ruin
 Break-Even Win Rate
 Losing Streaks
 Same Edge, Two Shapes
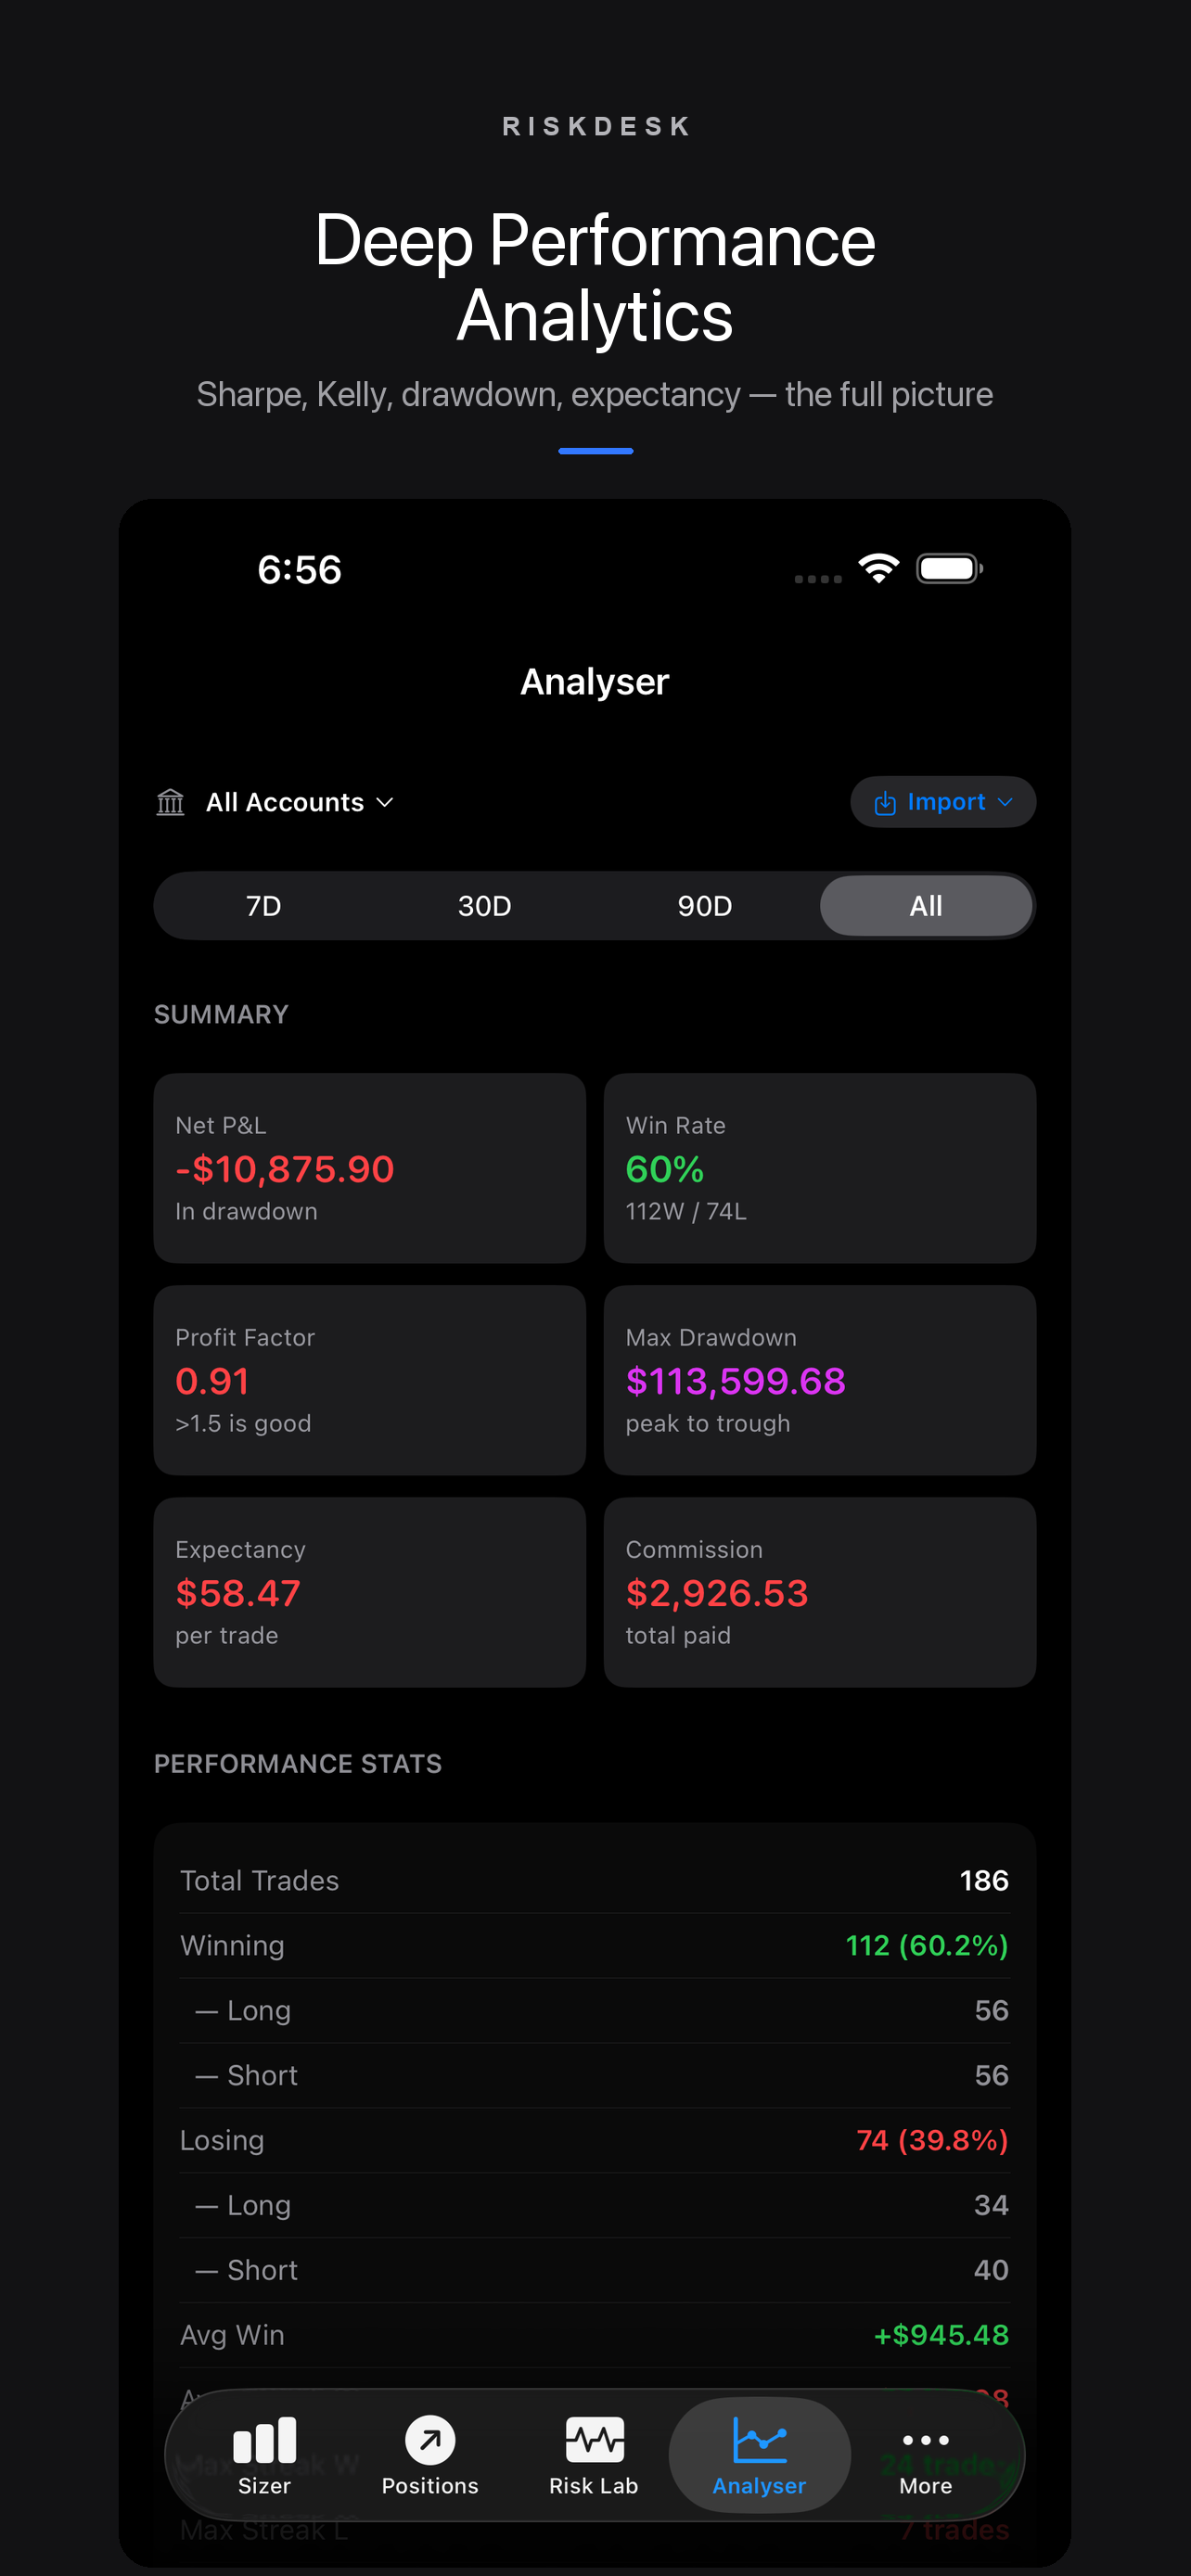
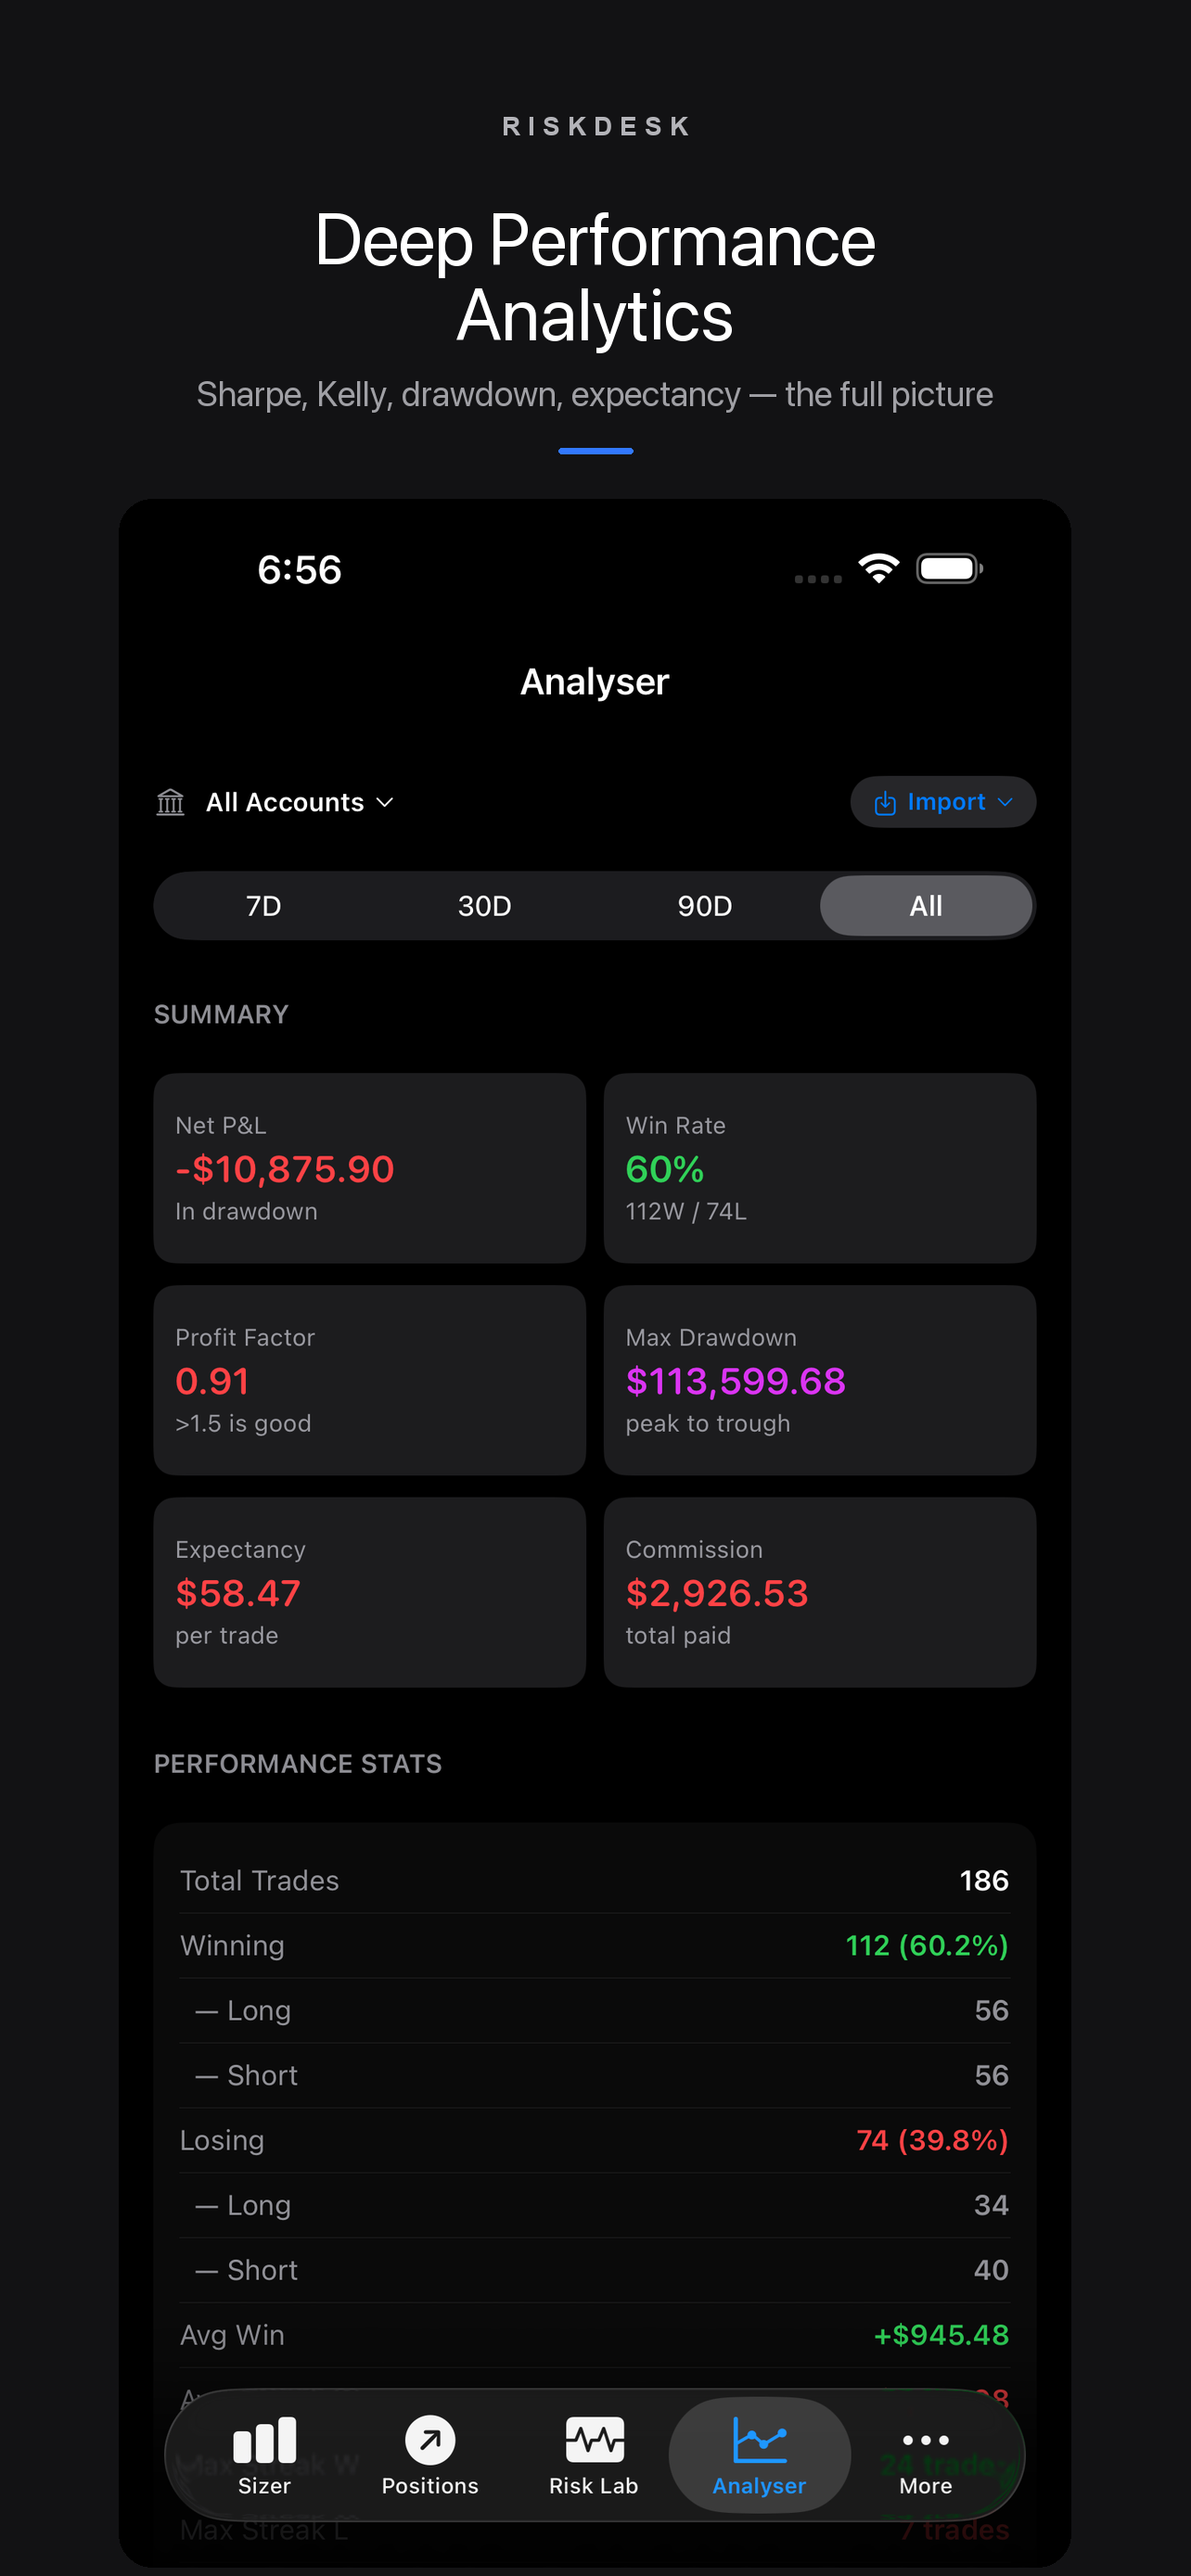
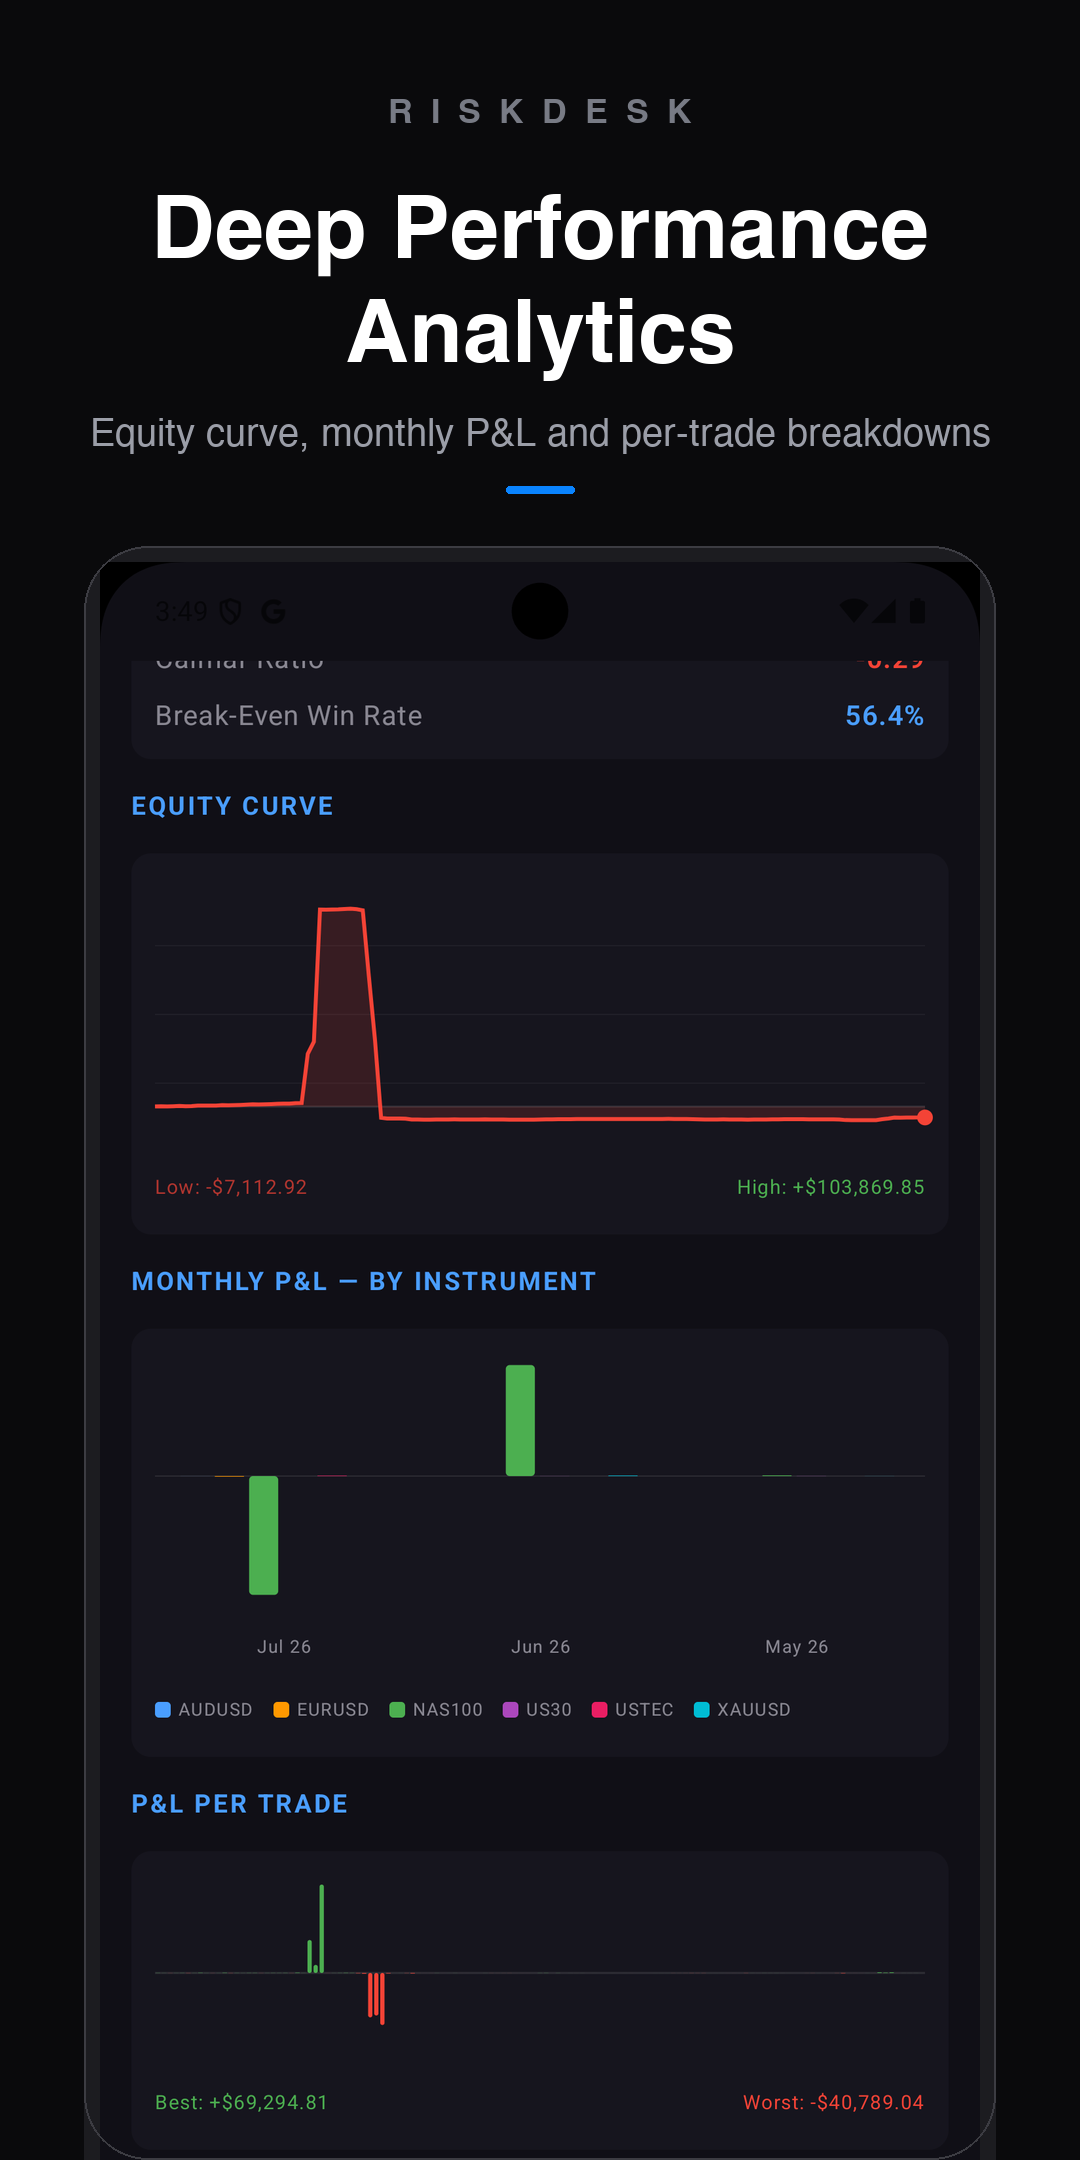
RiskDesk turns your trade history into a complete performance breakdown. Import CSV files from any broker or log trades manually.
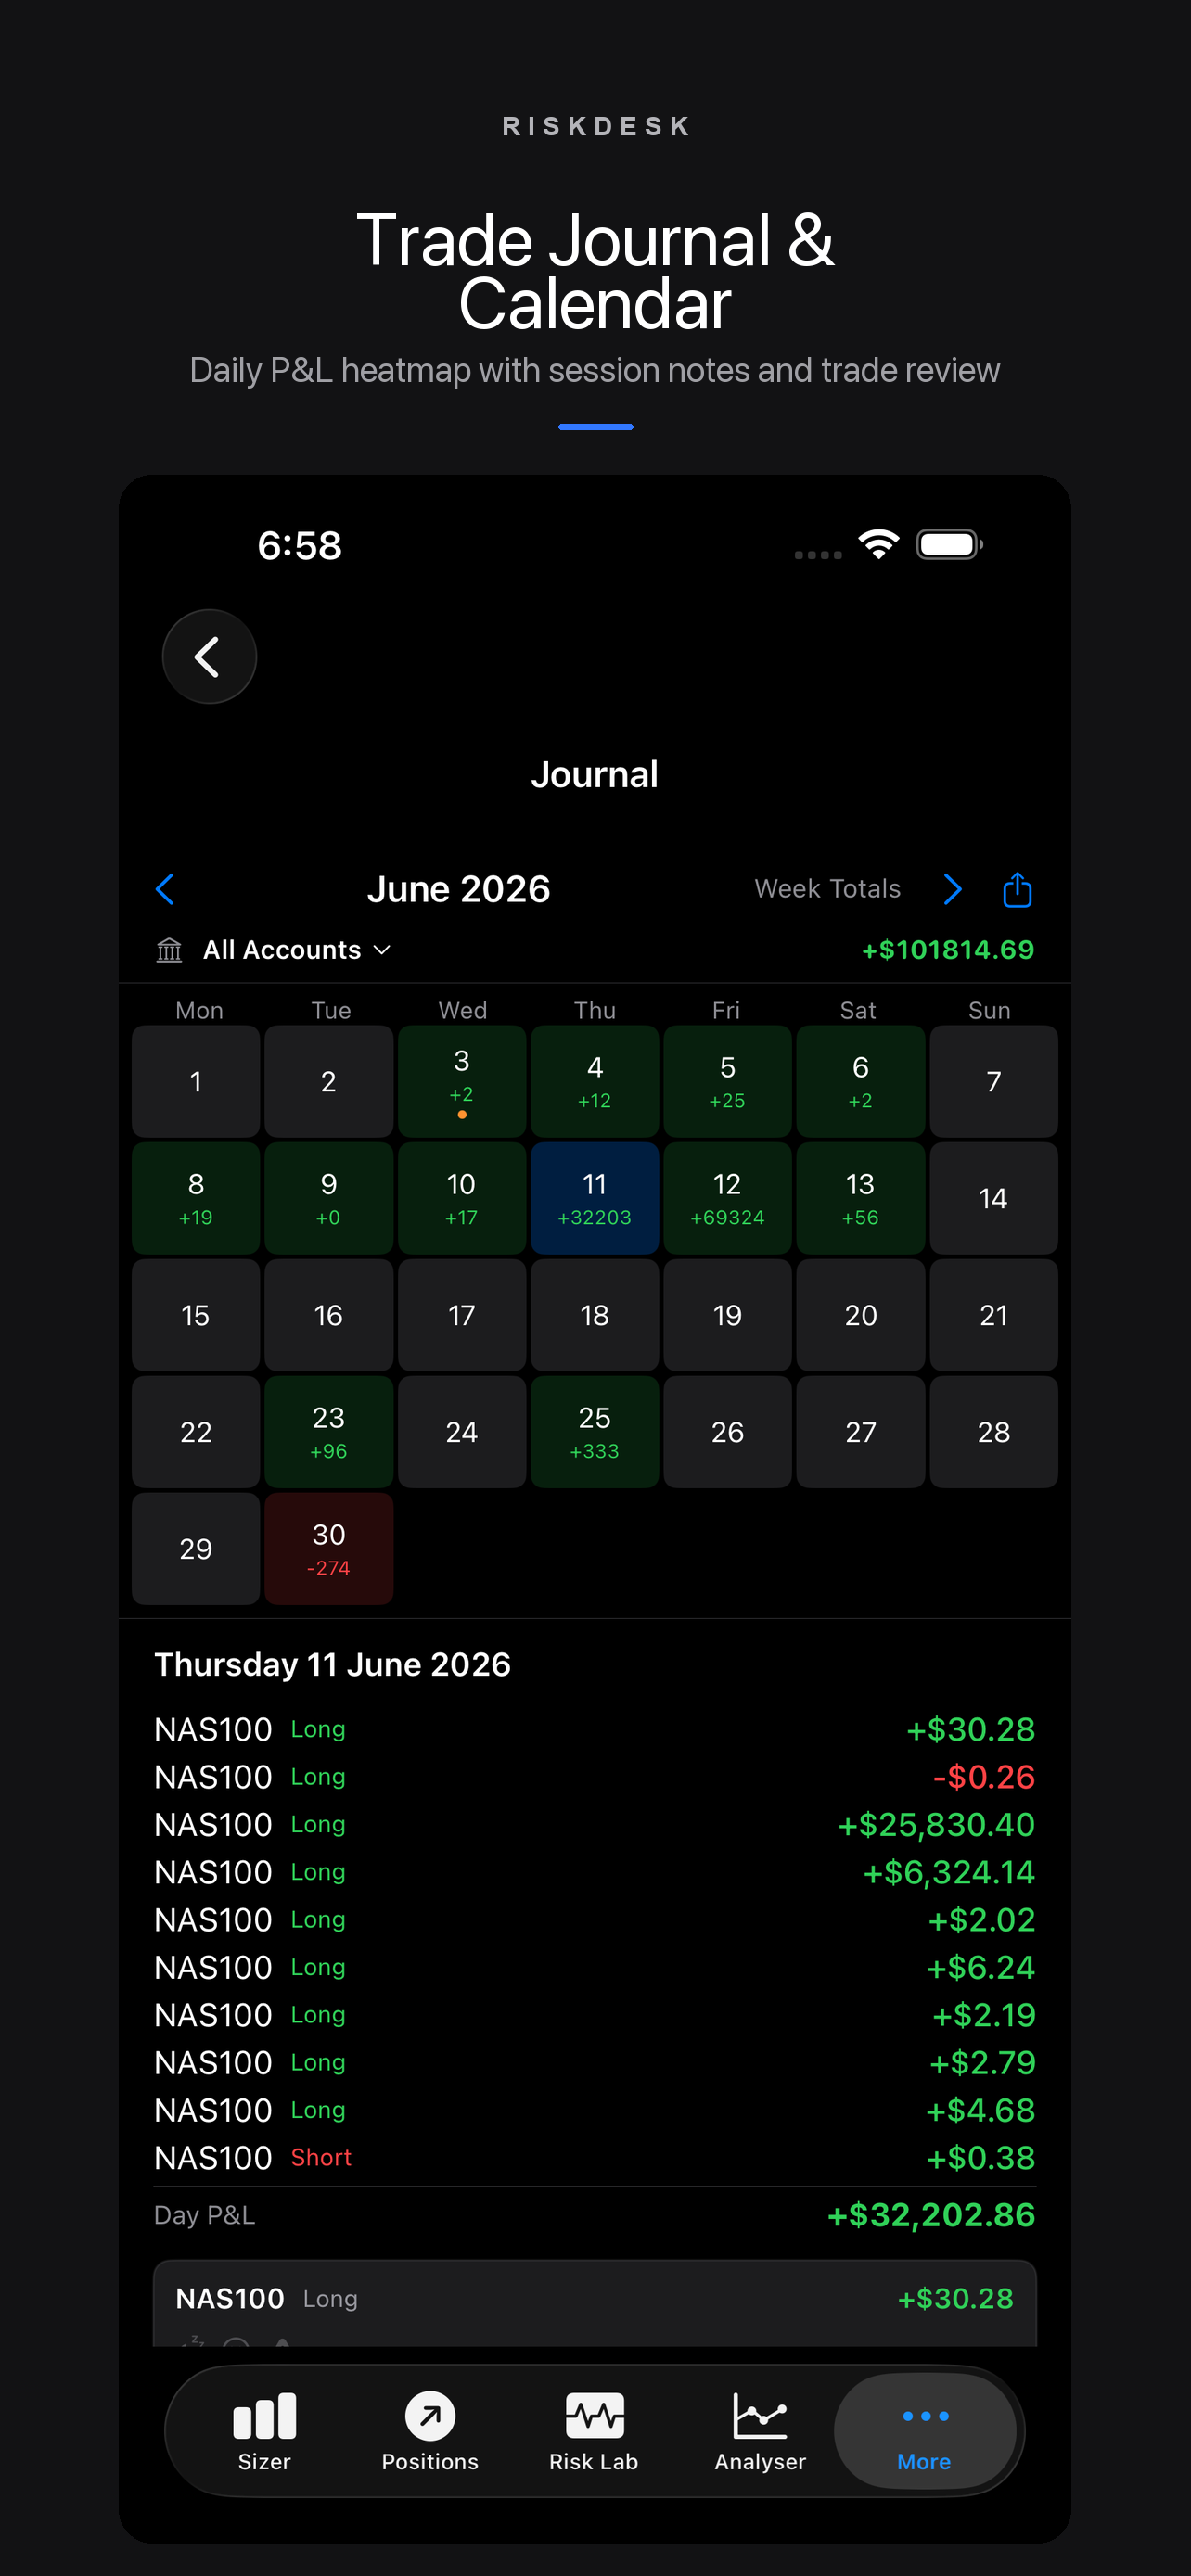
The best traders know emotions drive decisions. Log notes and emotional state for every day — and surface weekly patterns you'd otherwise miss.
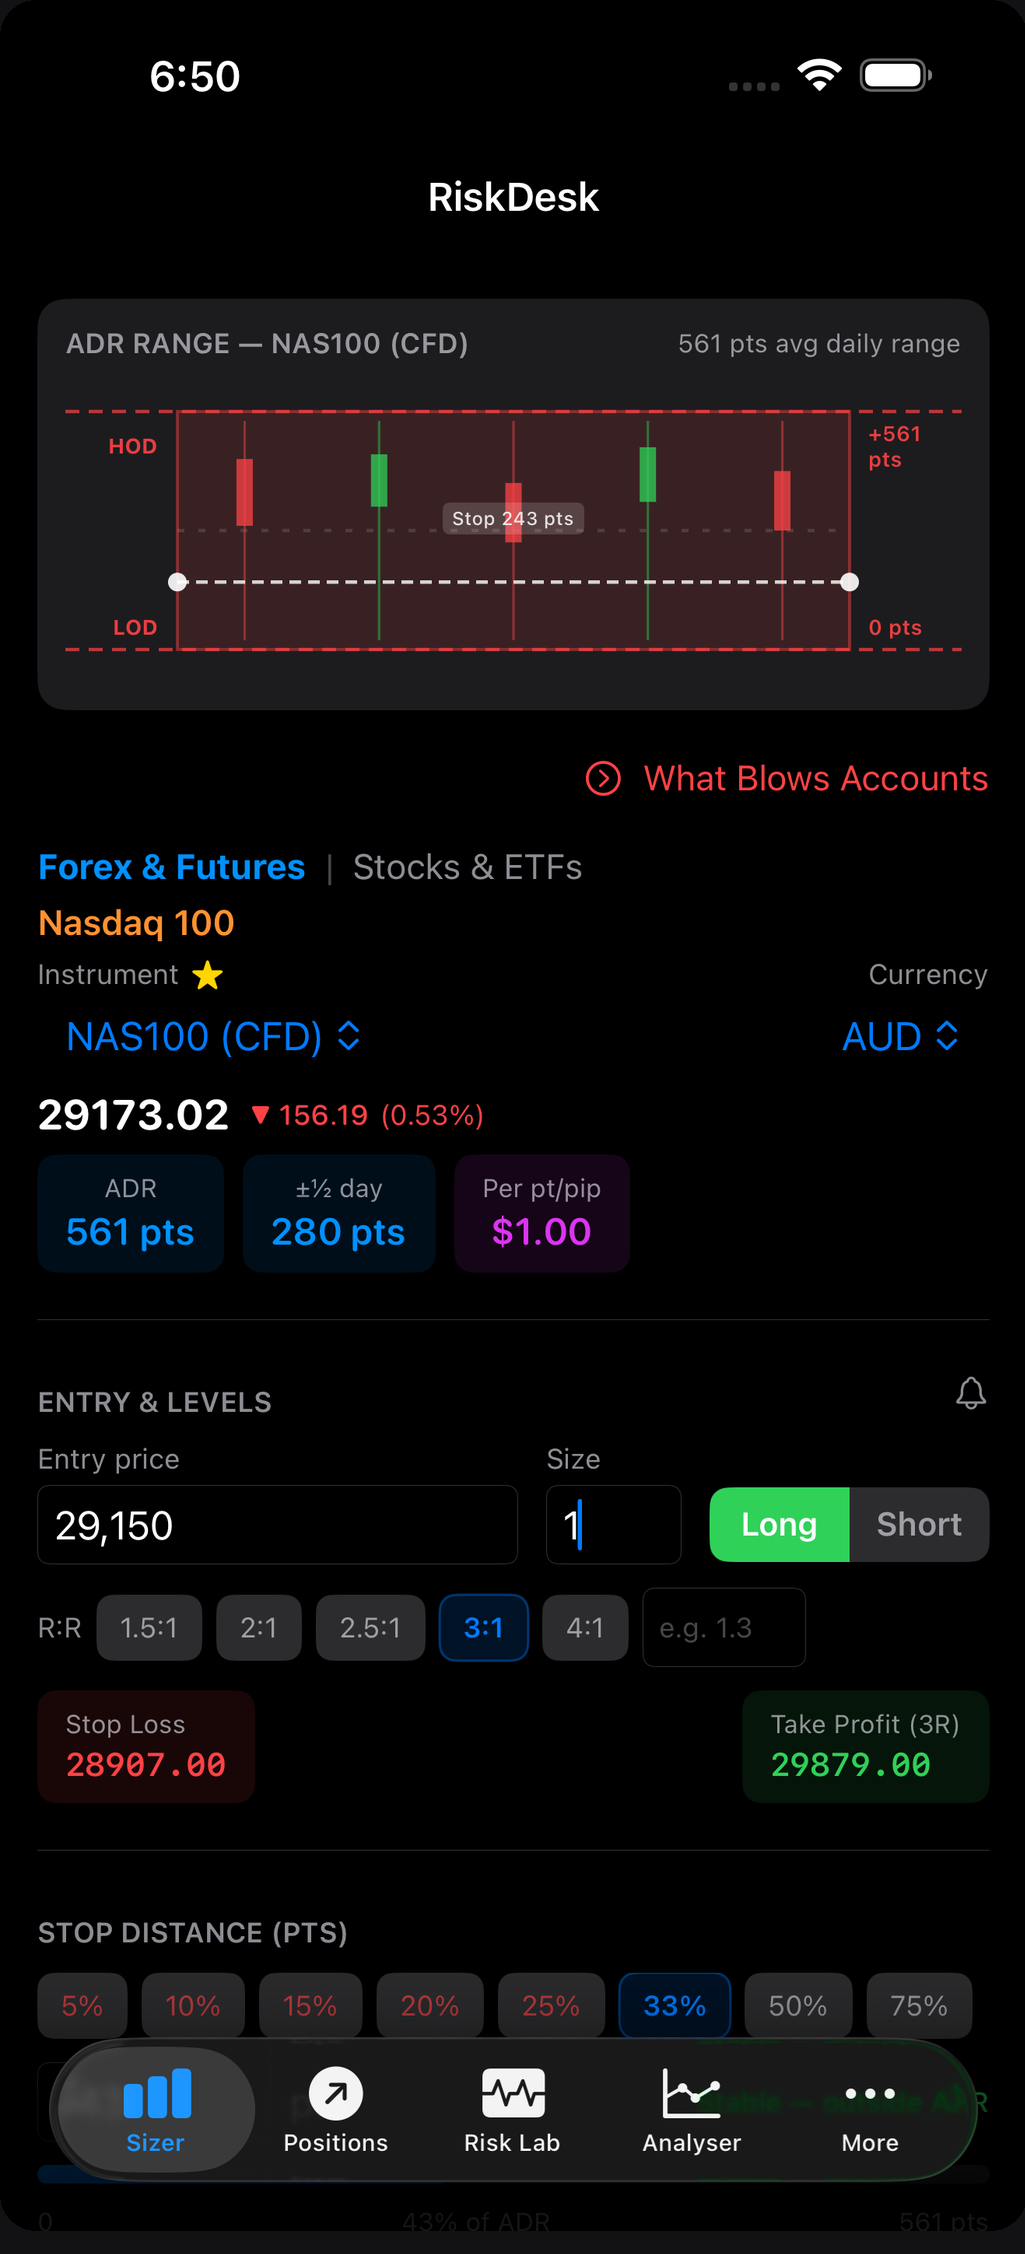
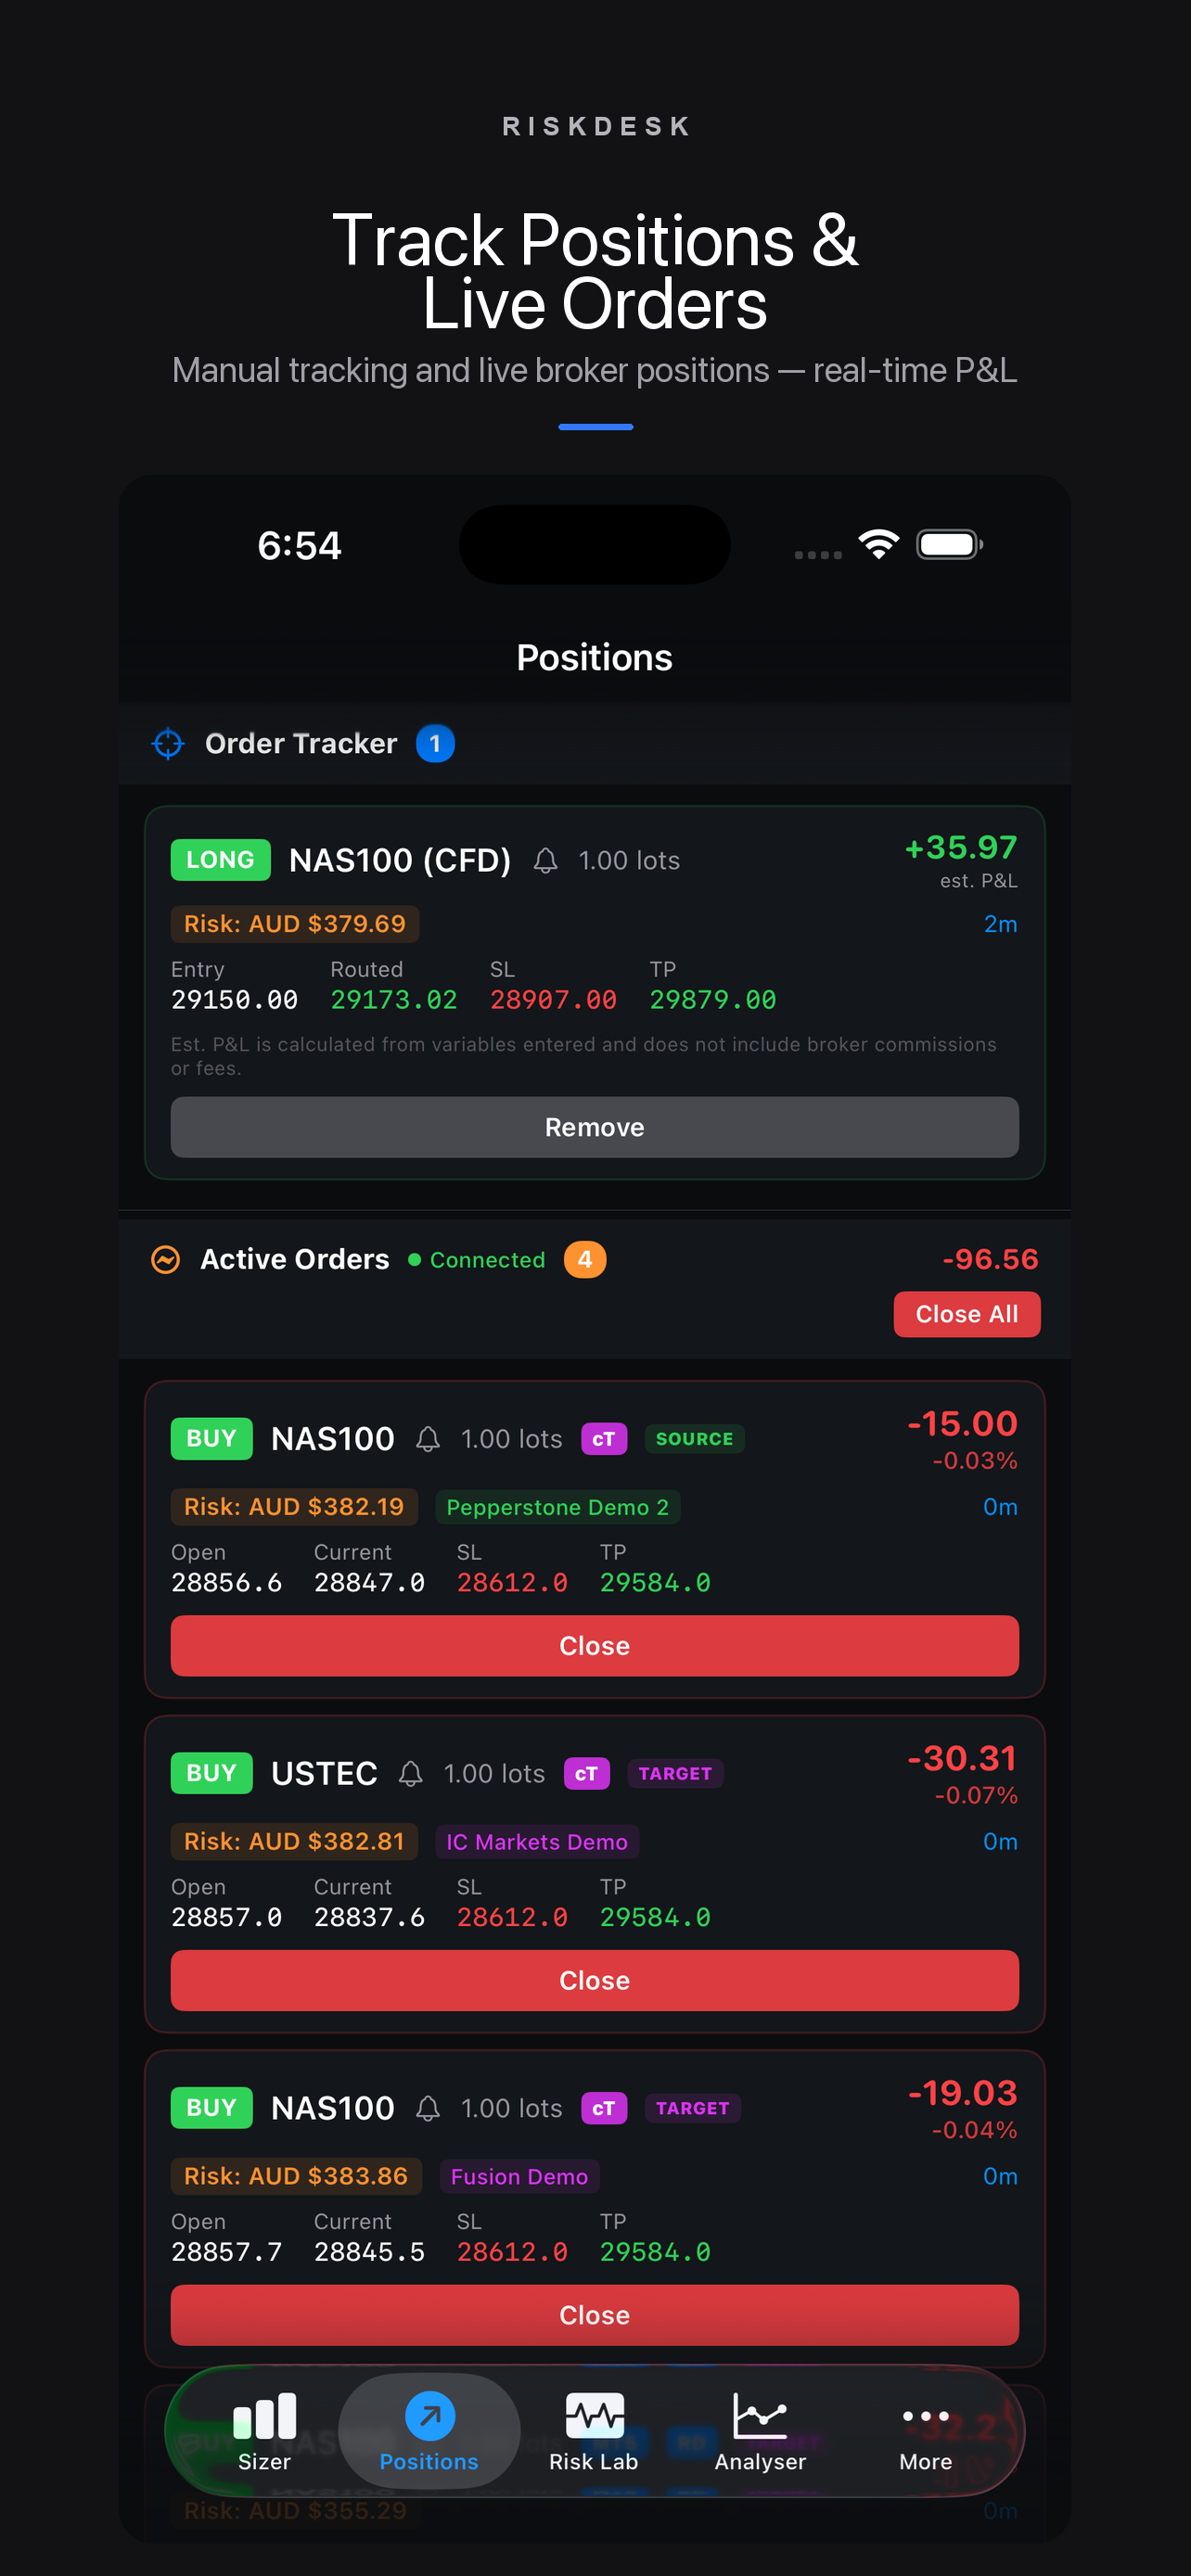
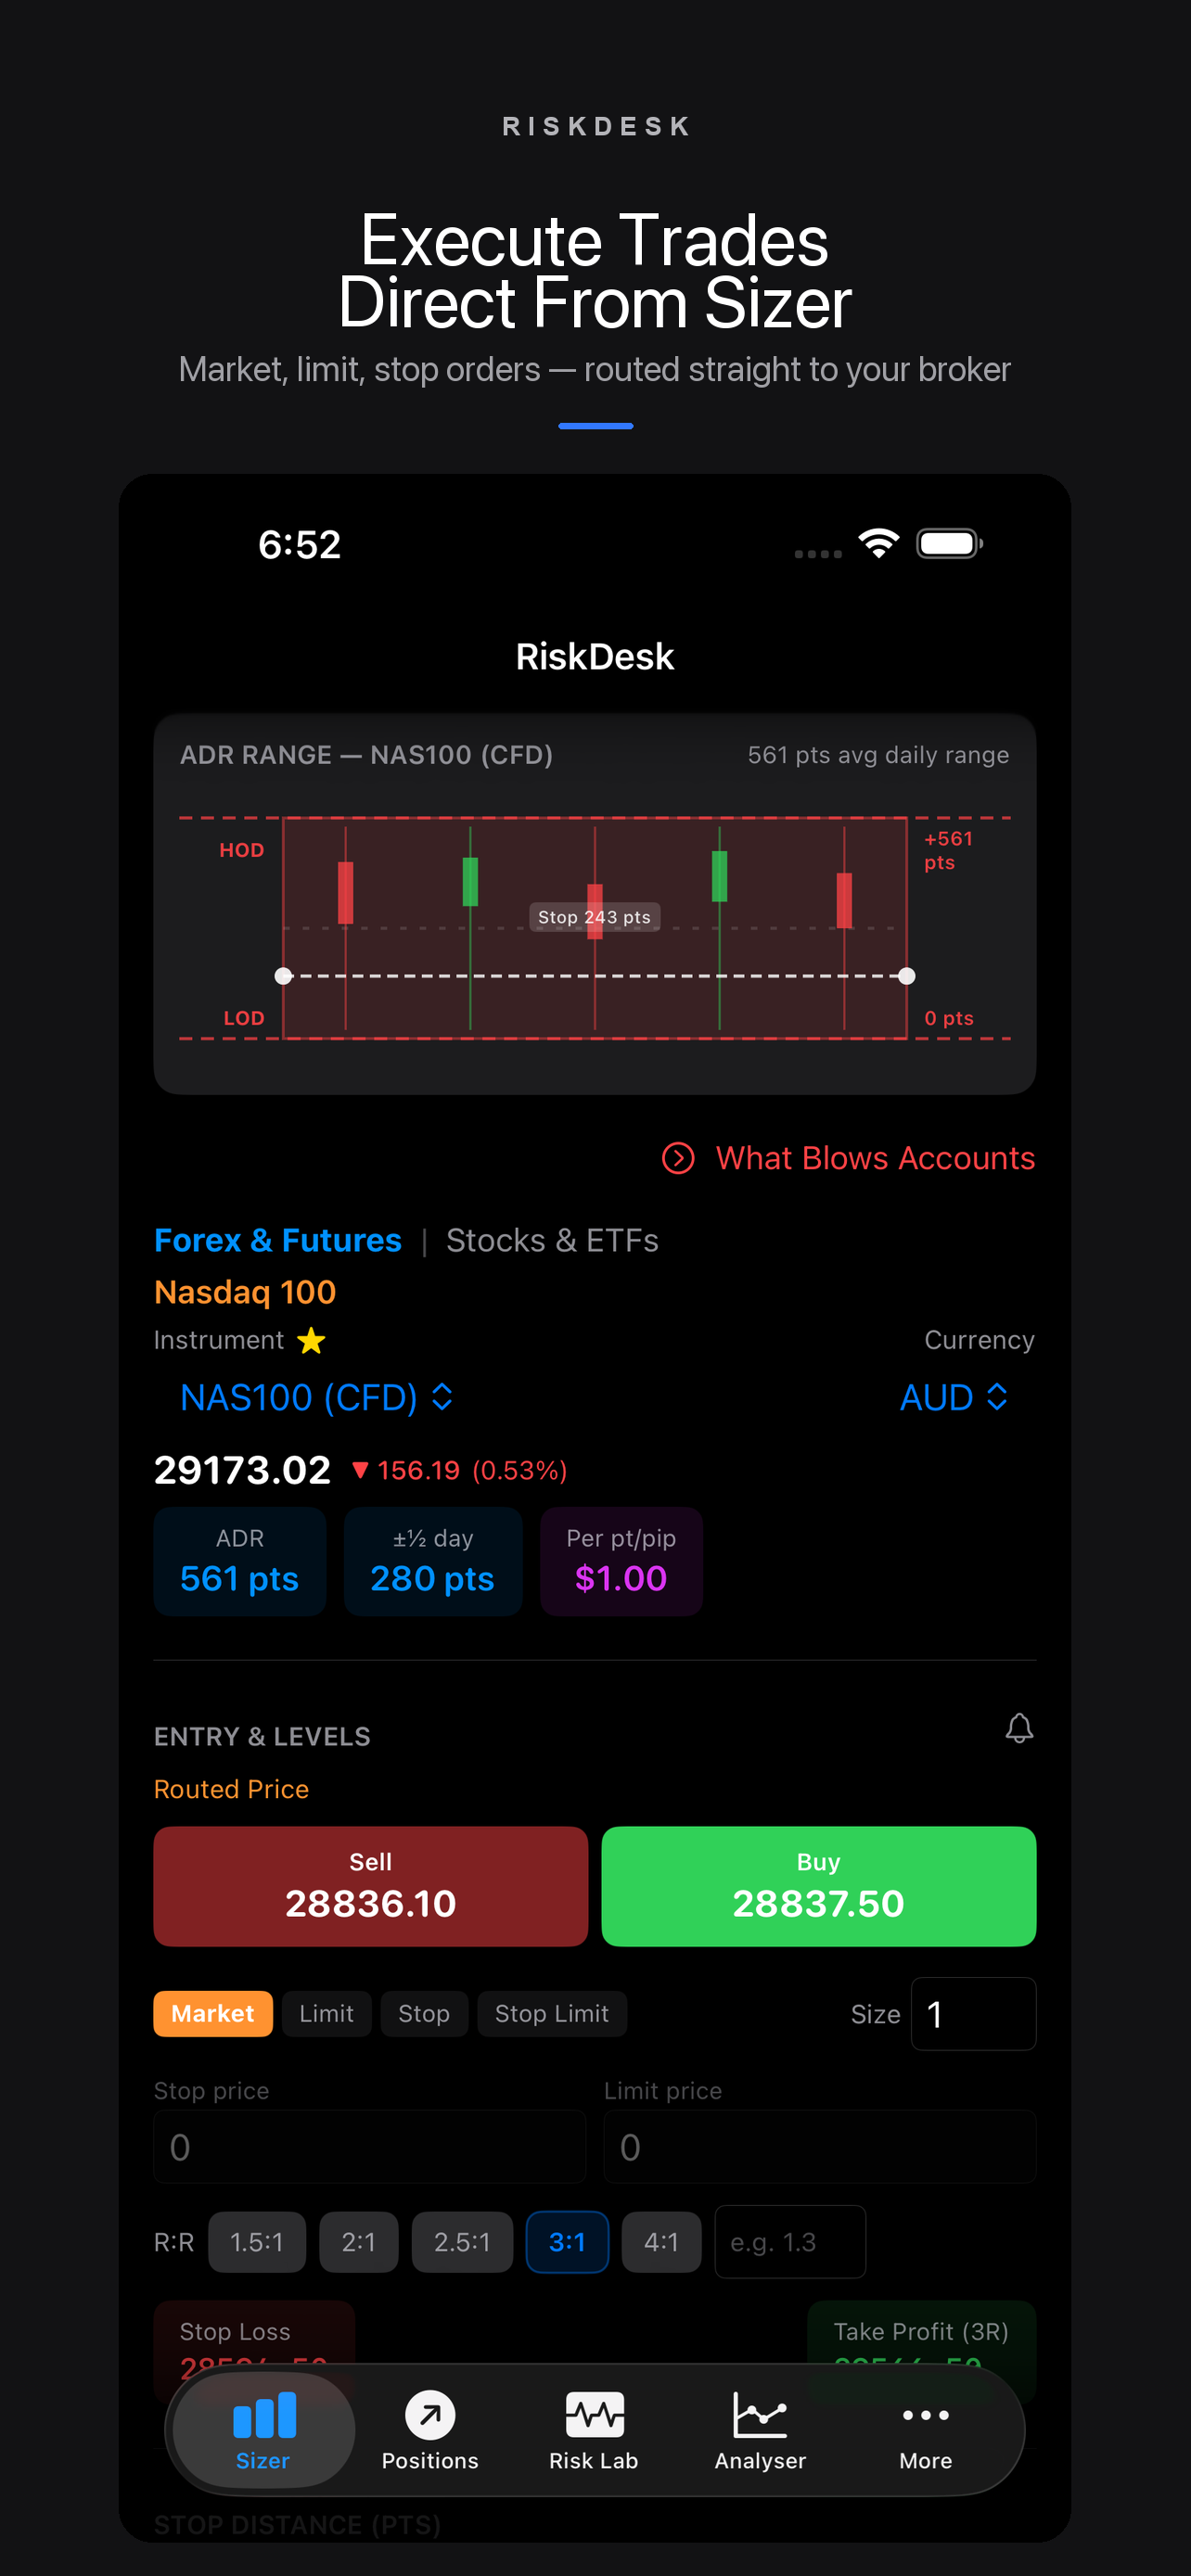
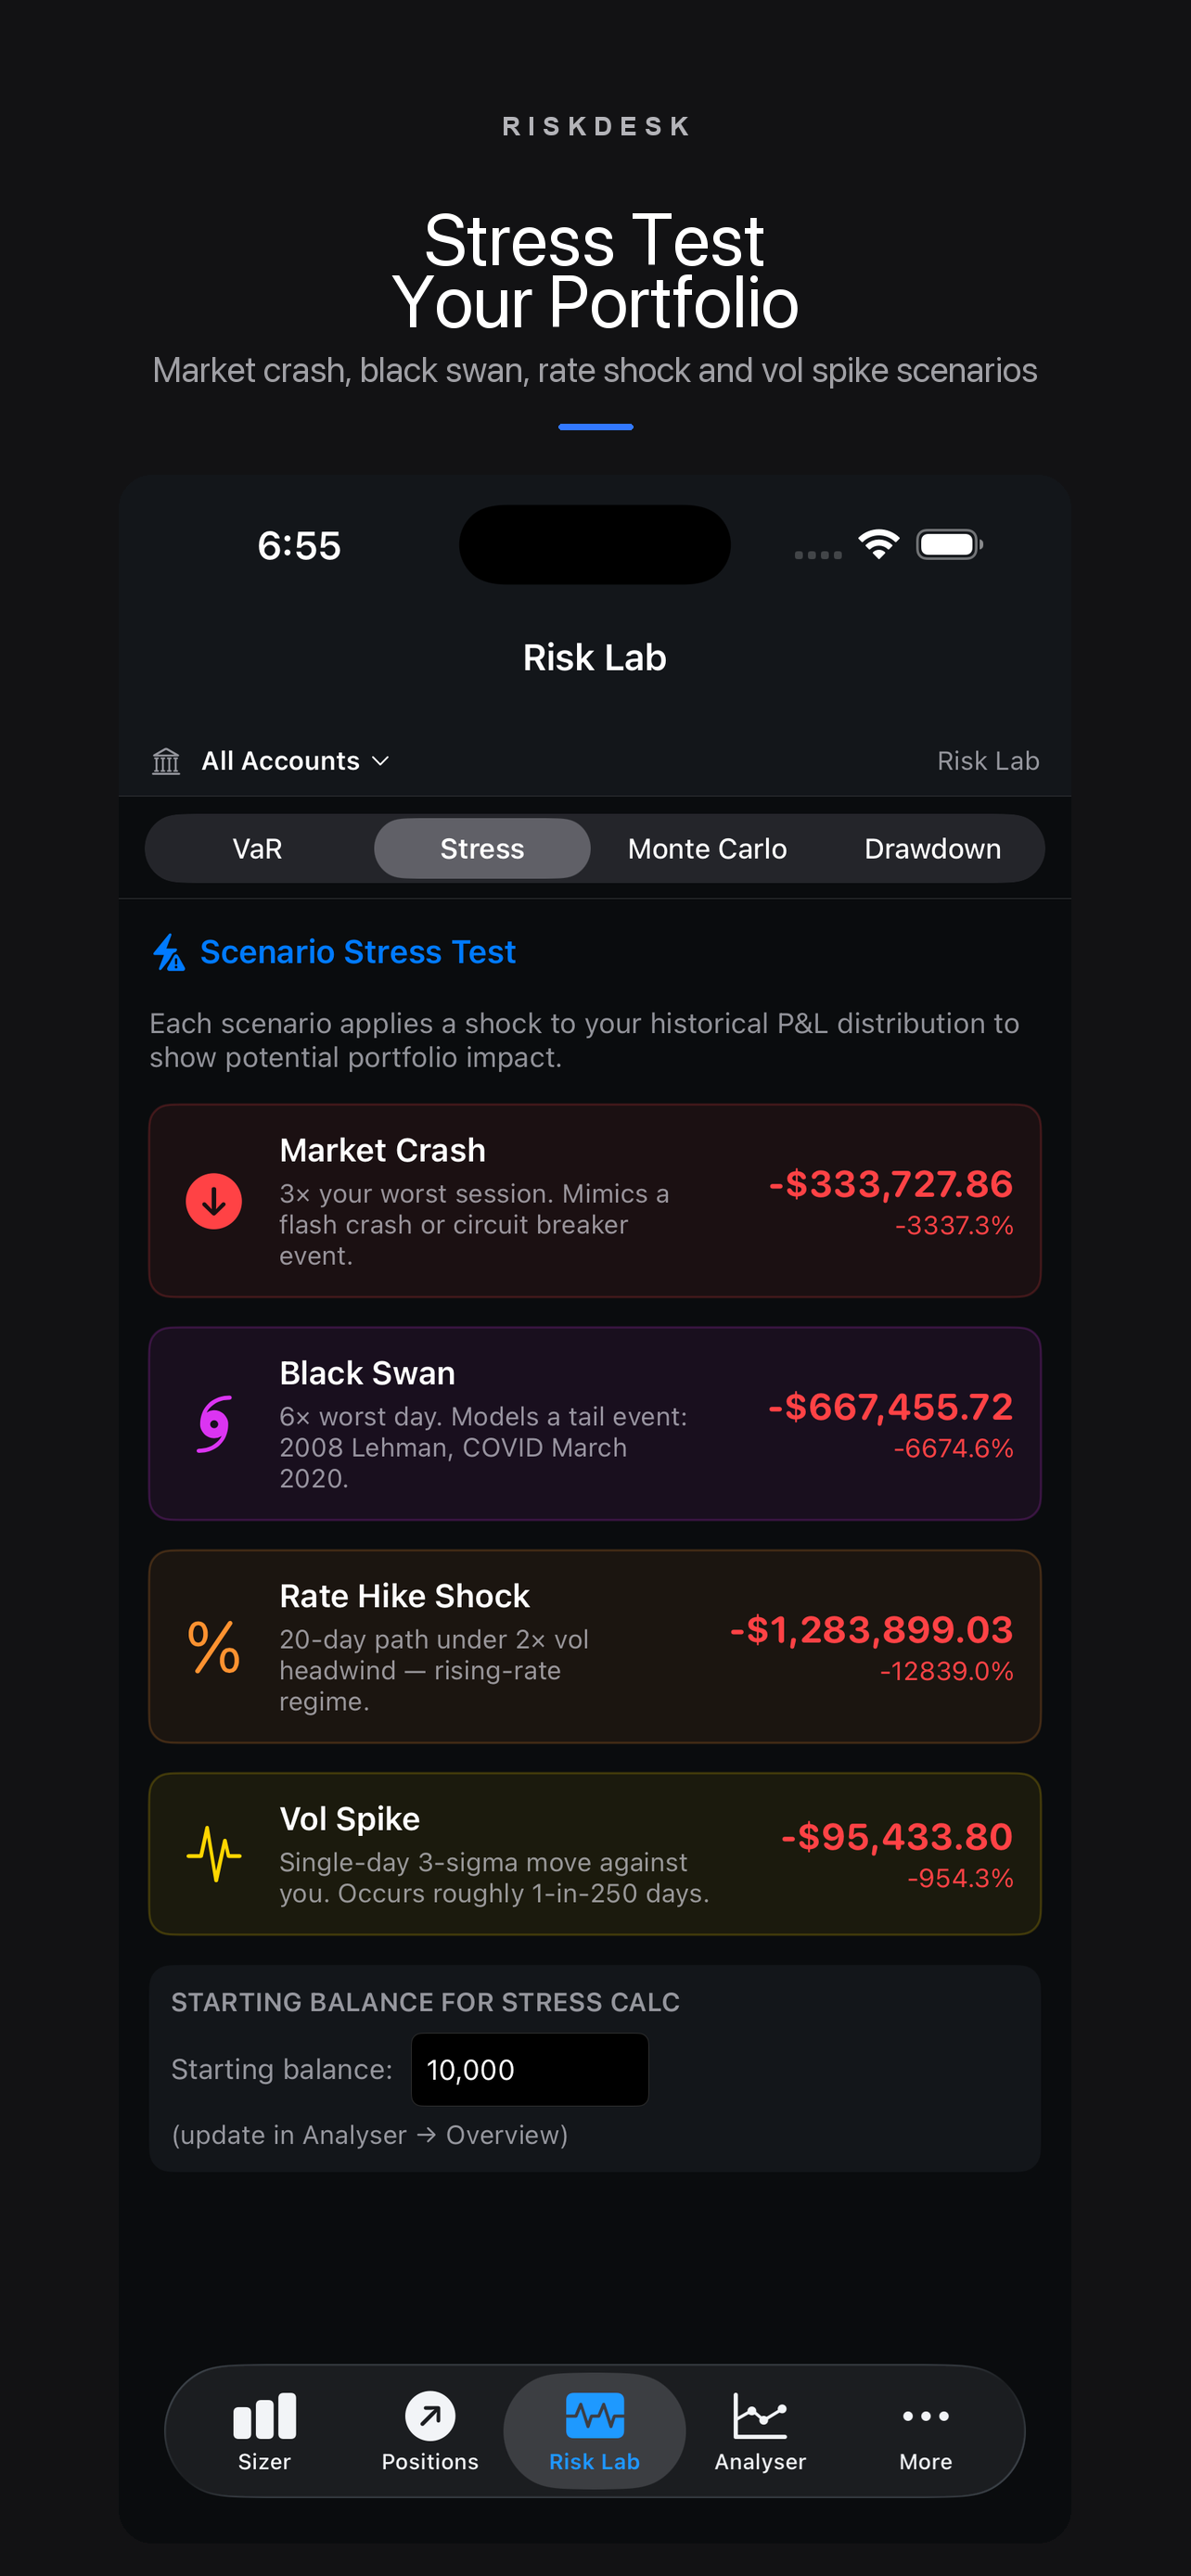
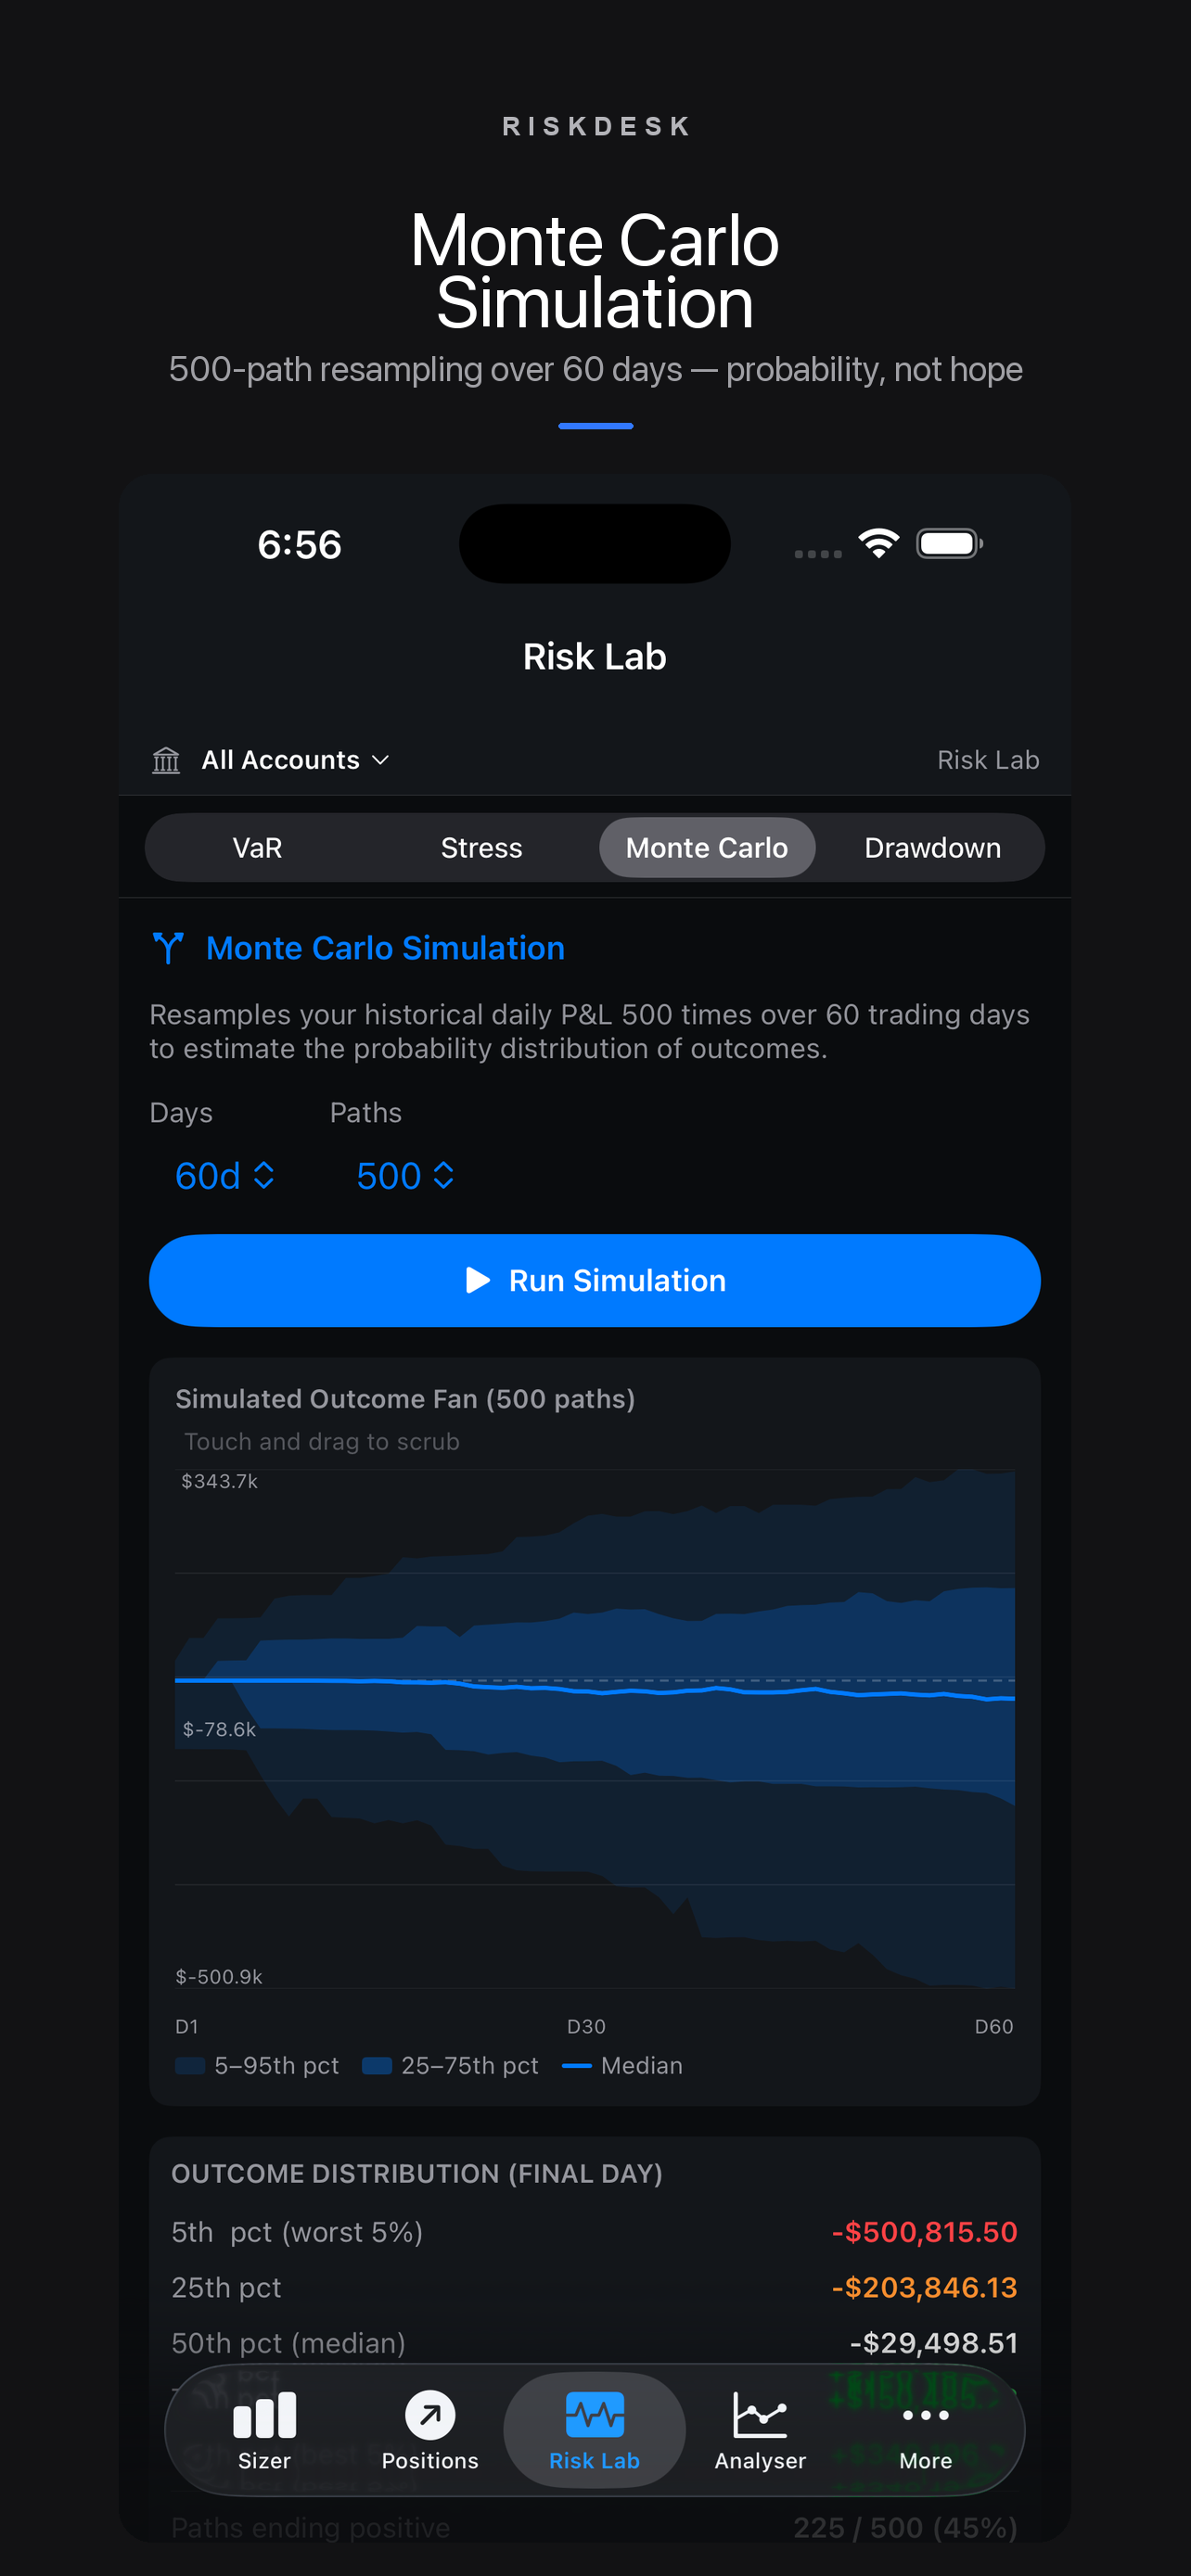
Every feature available on Mac — position sizing, analytics, journal, accounts — natively on iPhone. Built for traders who are always at their desk or always away from it.
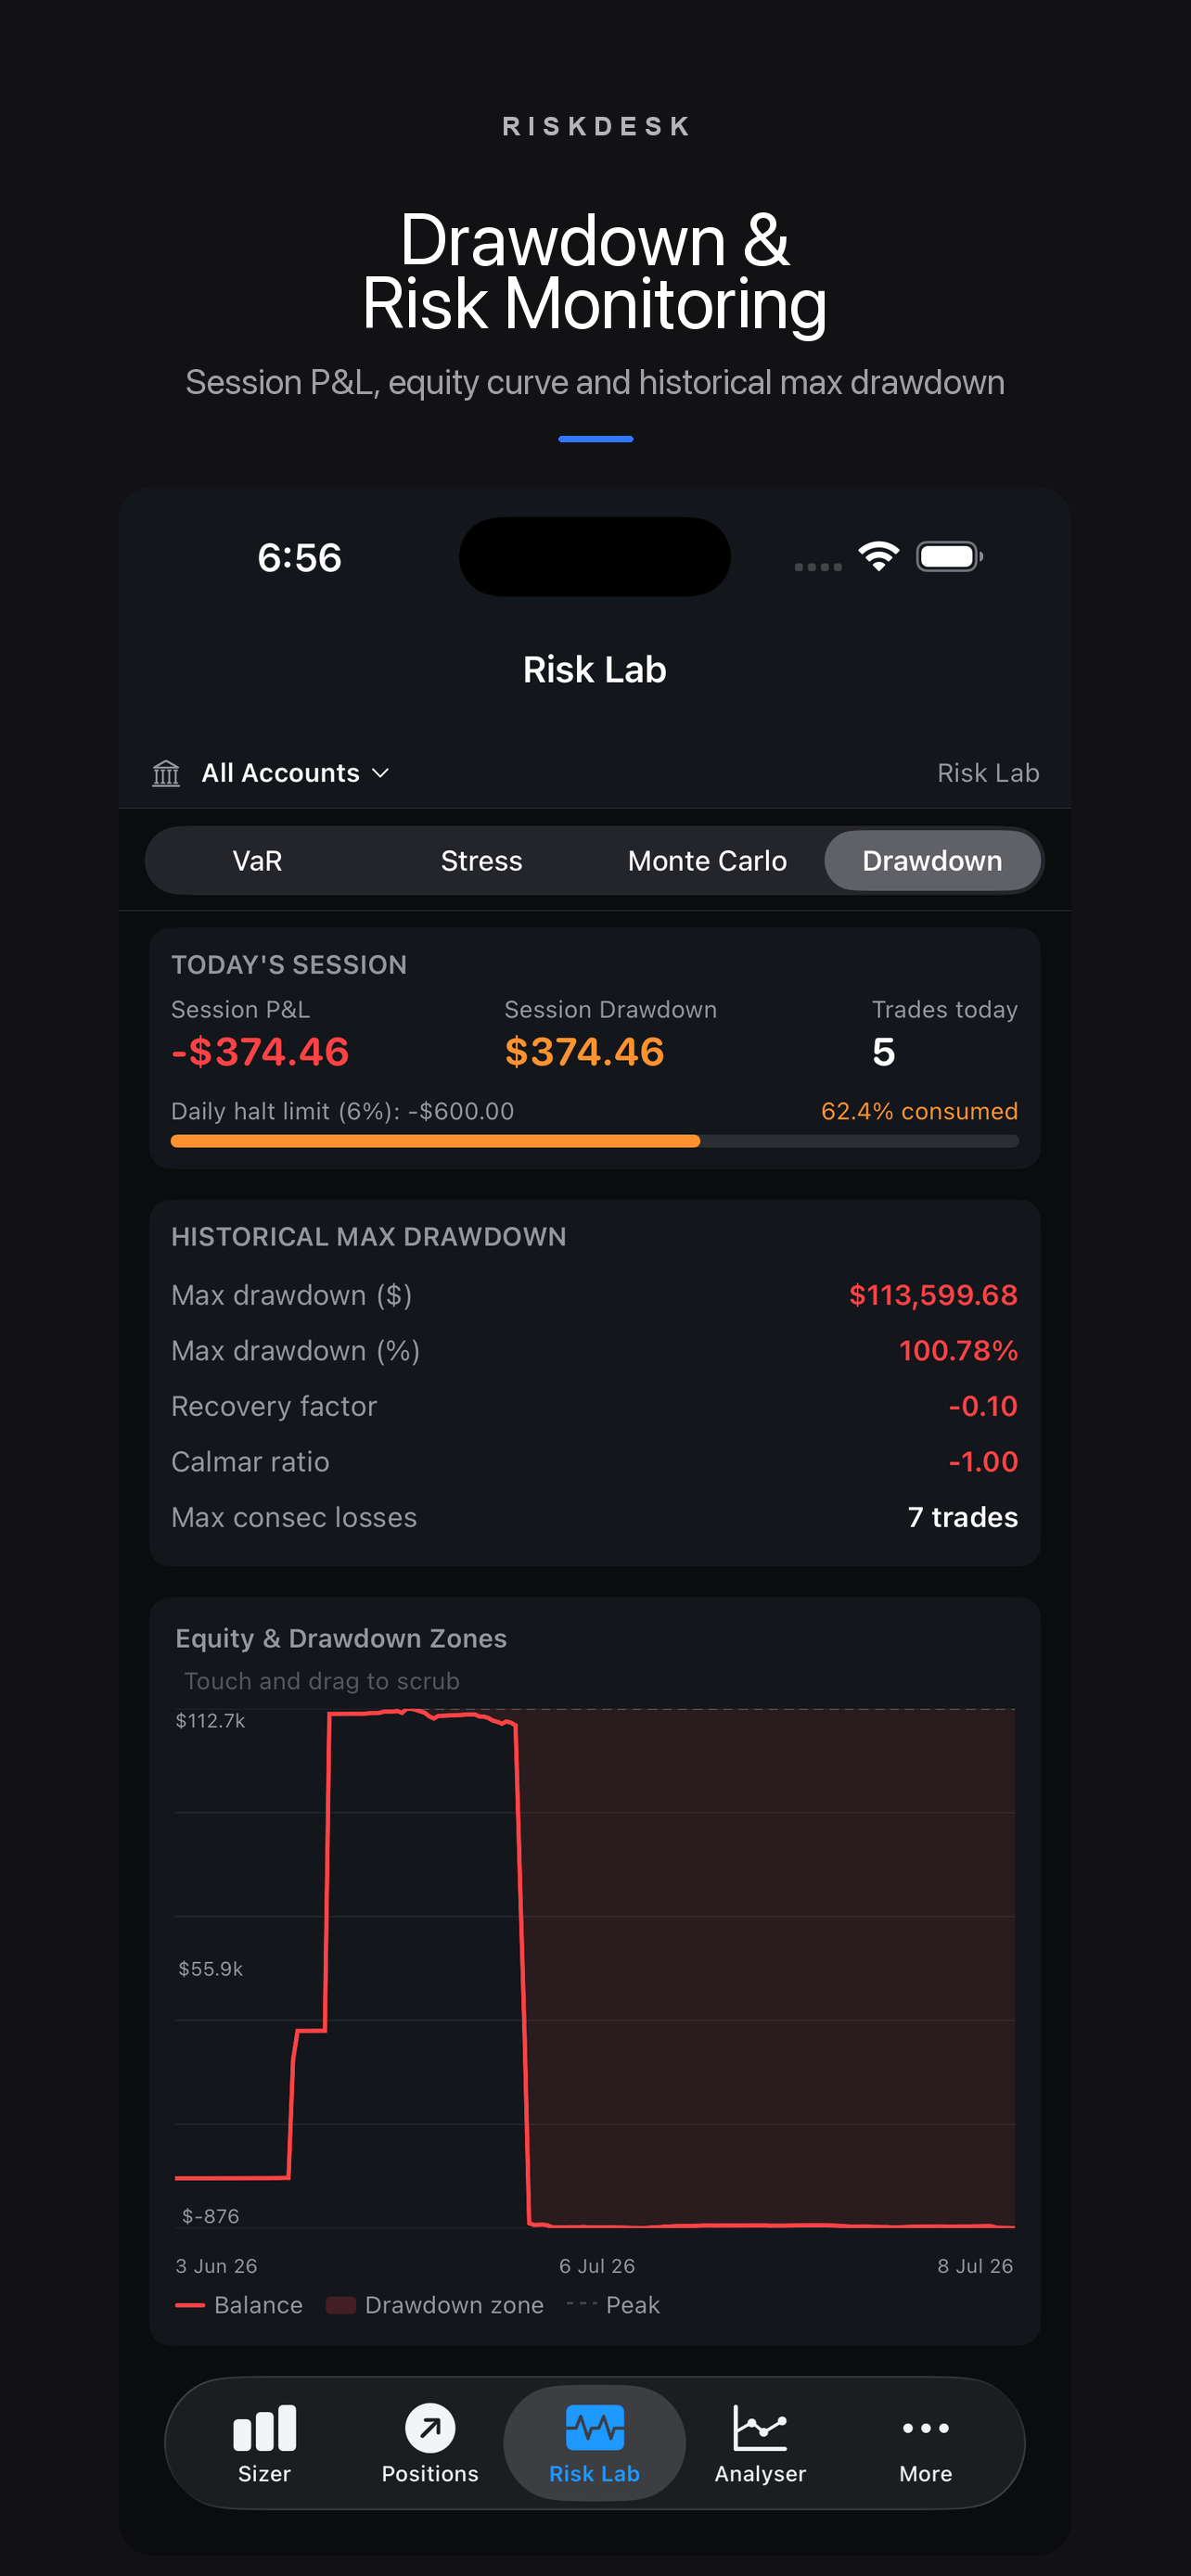
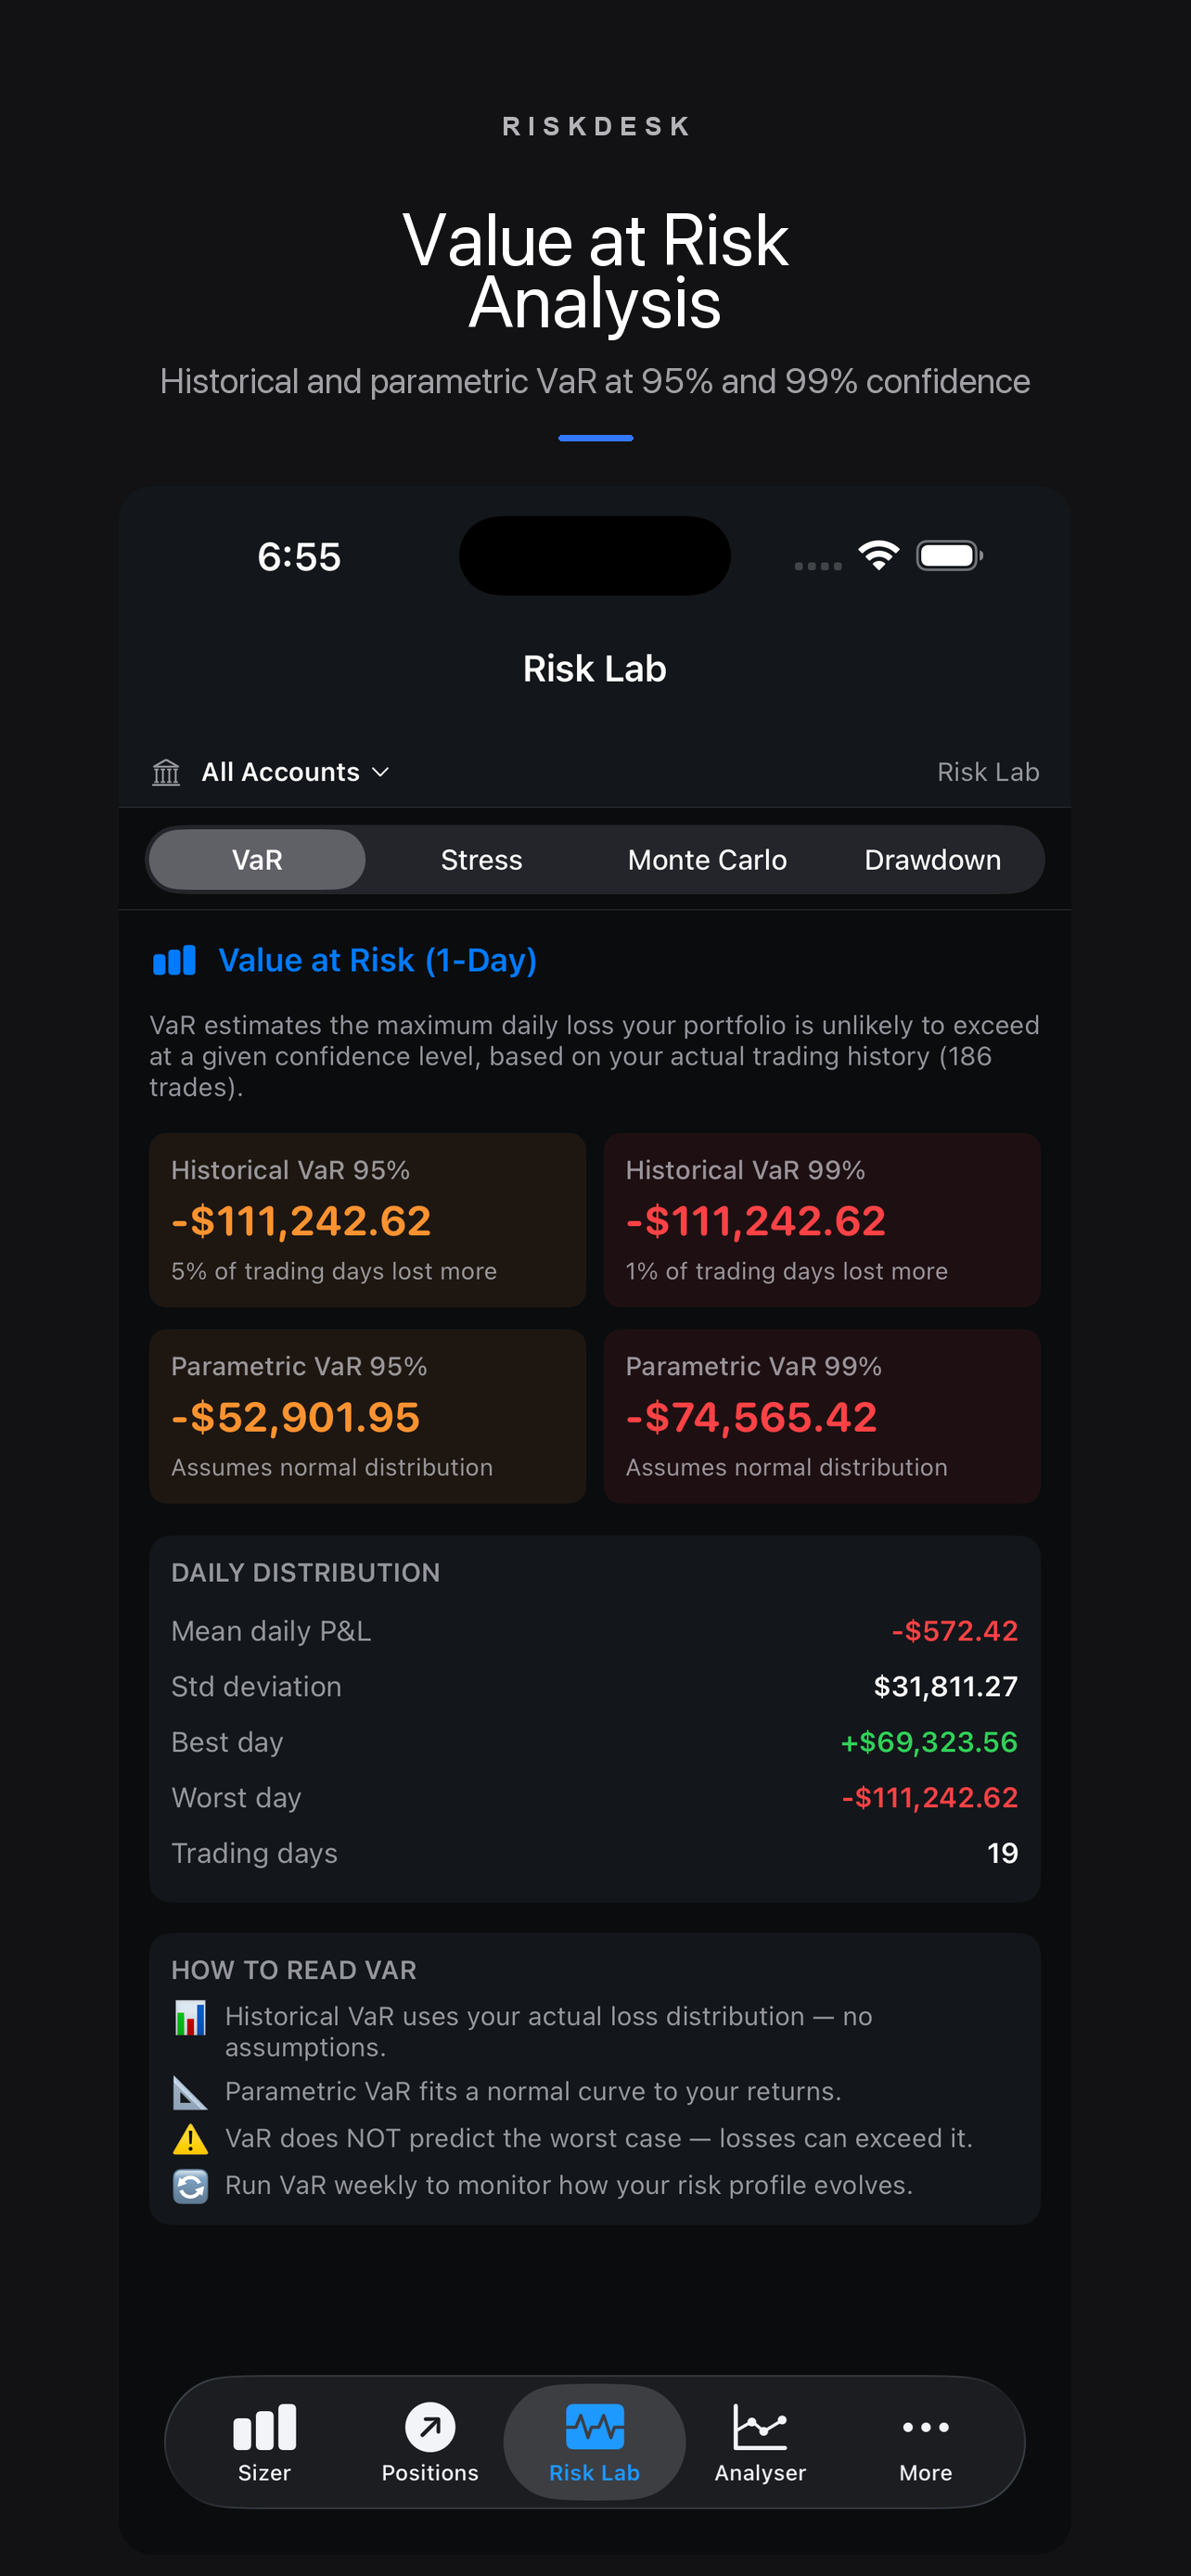
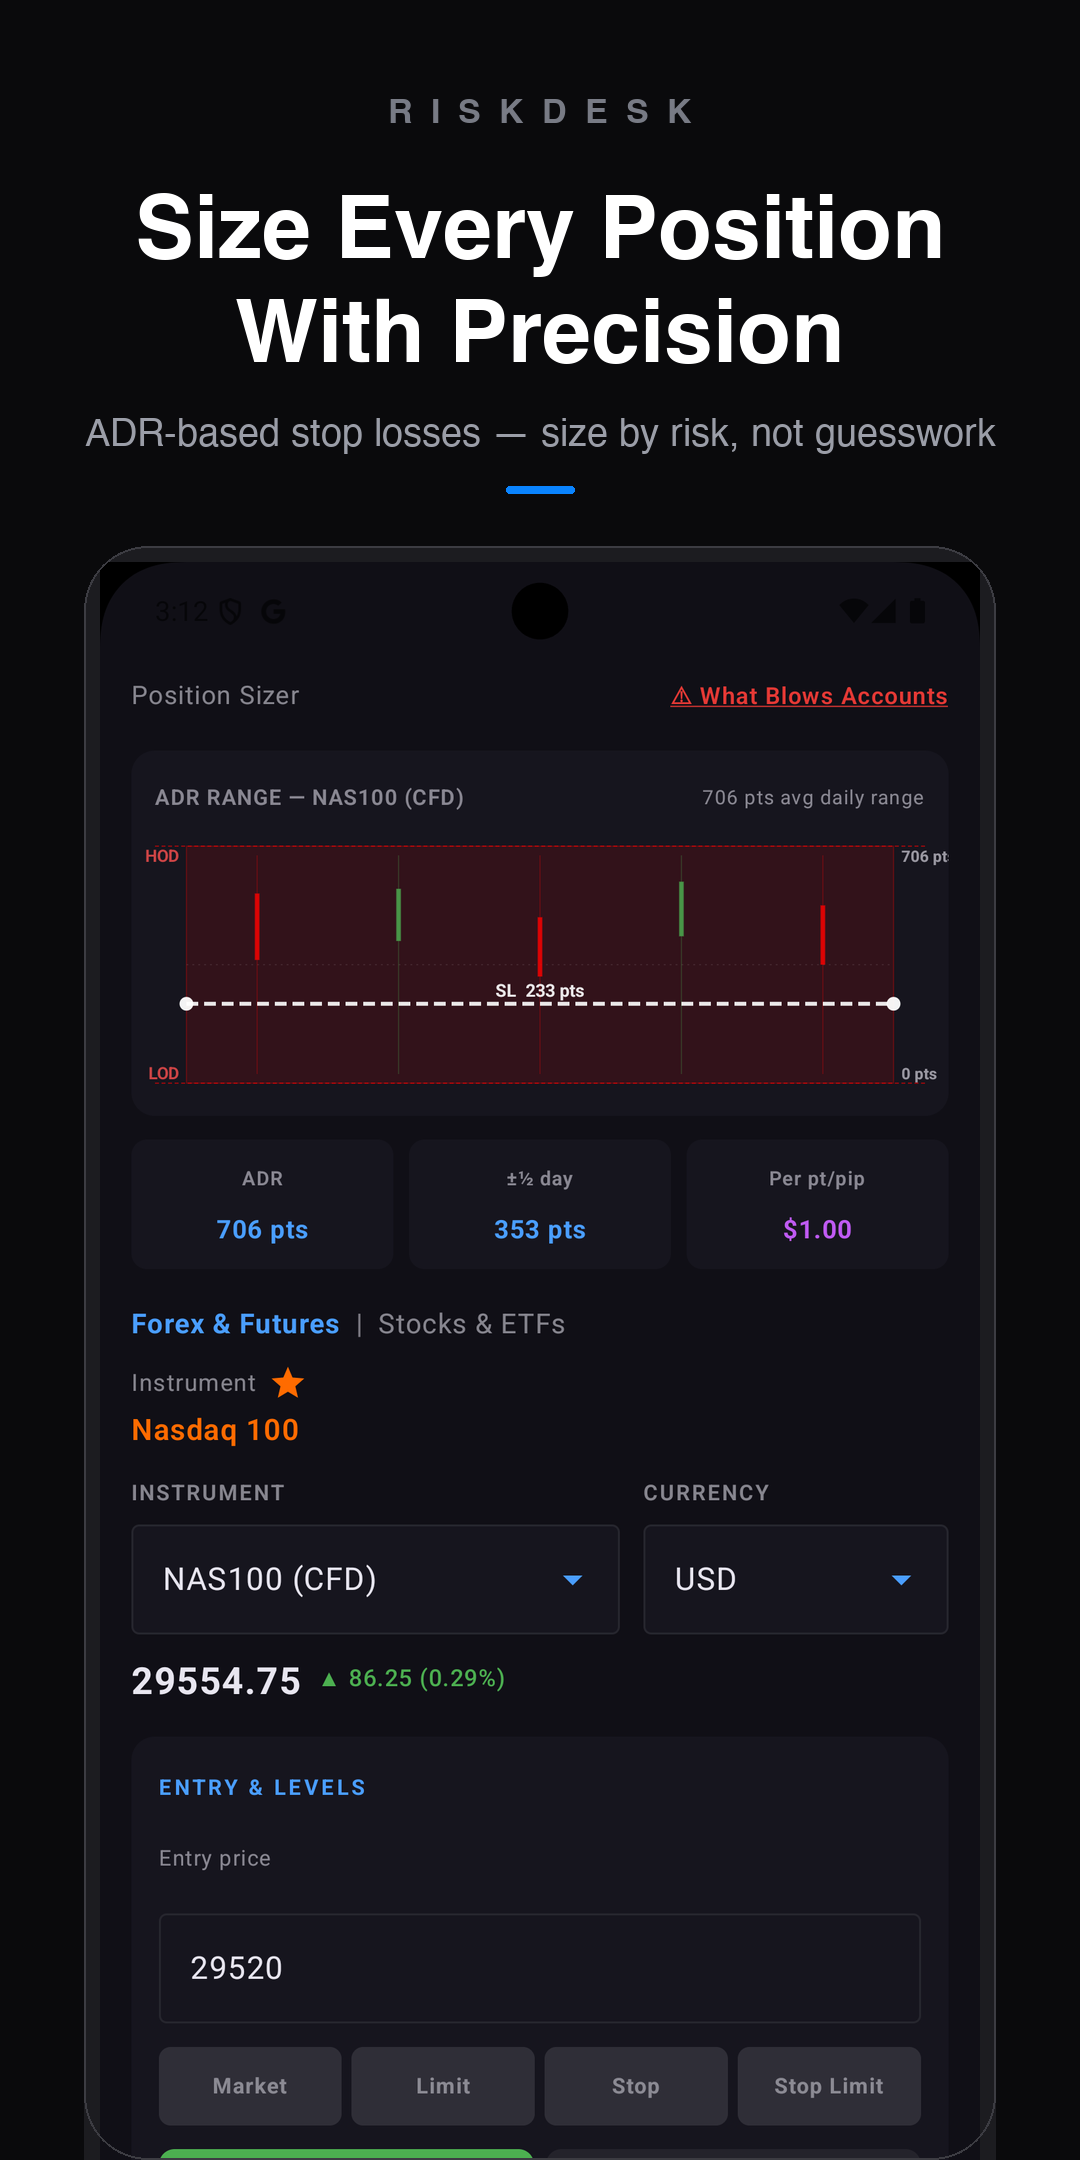
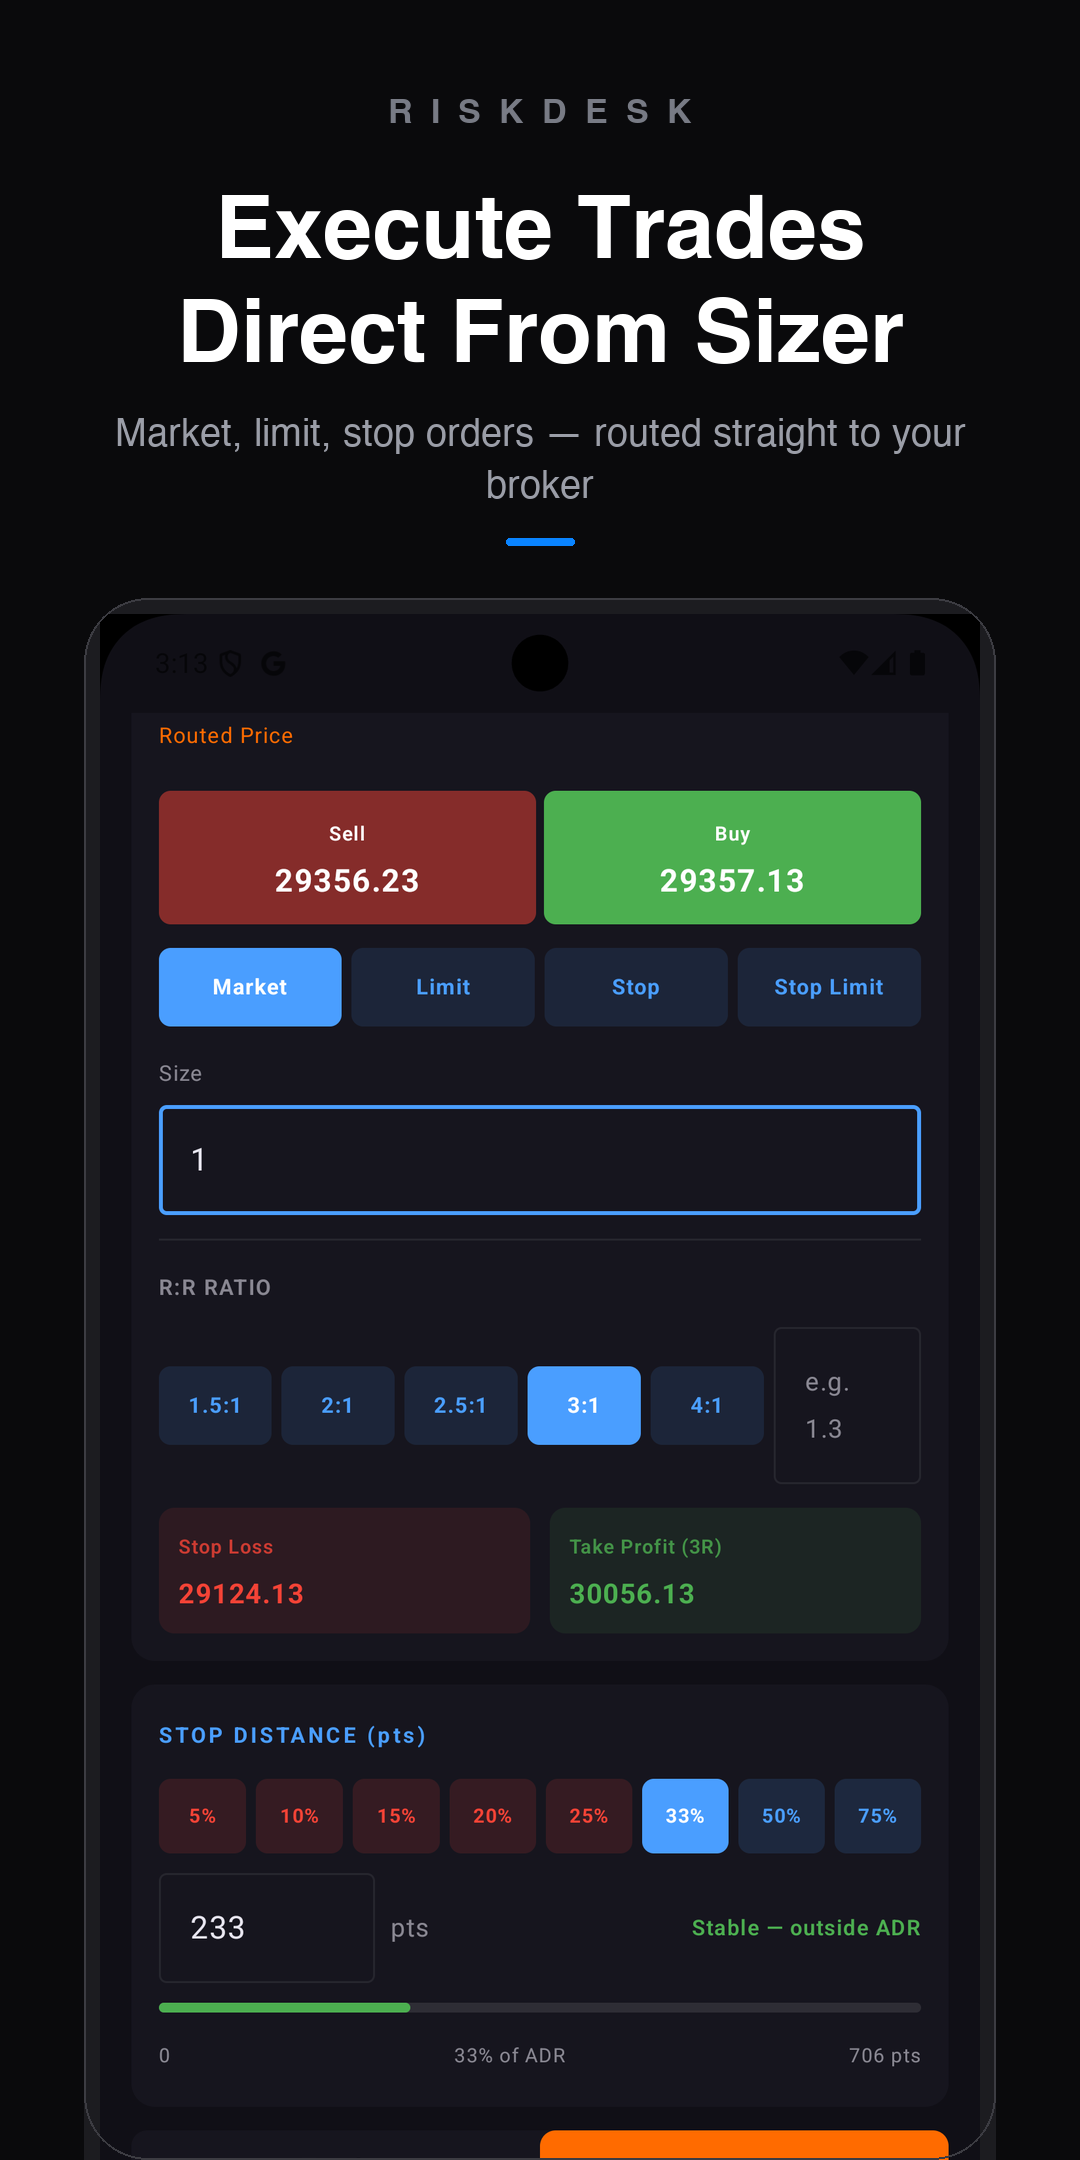
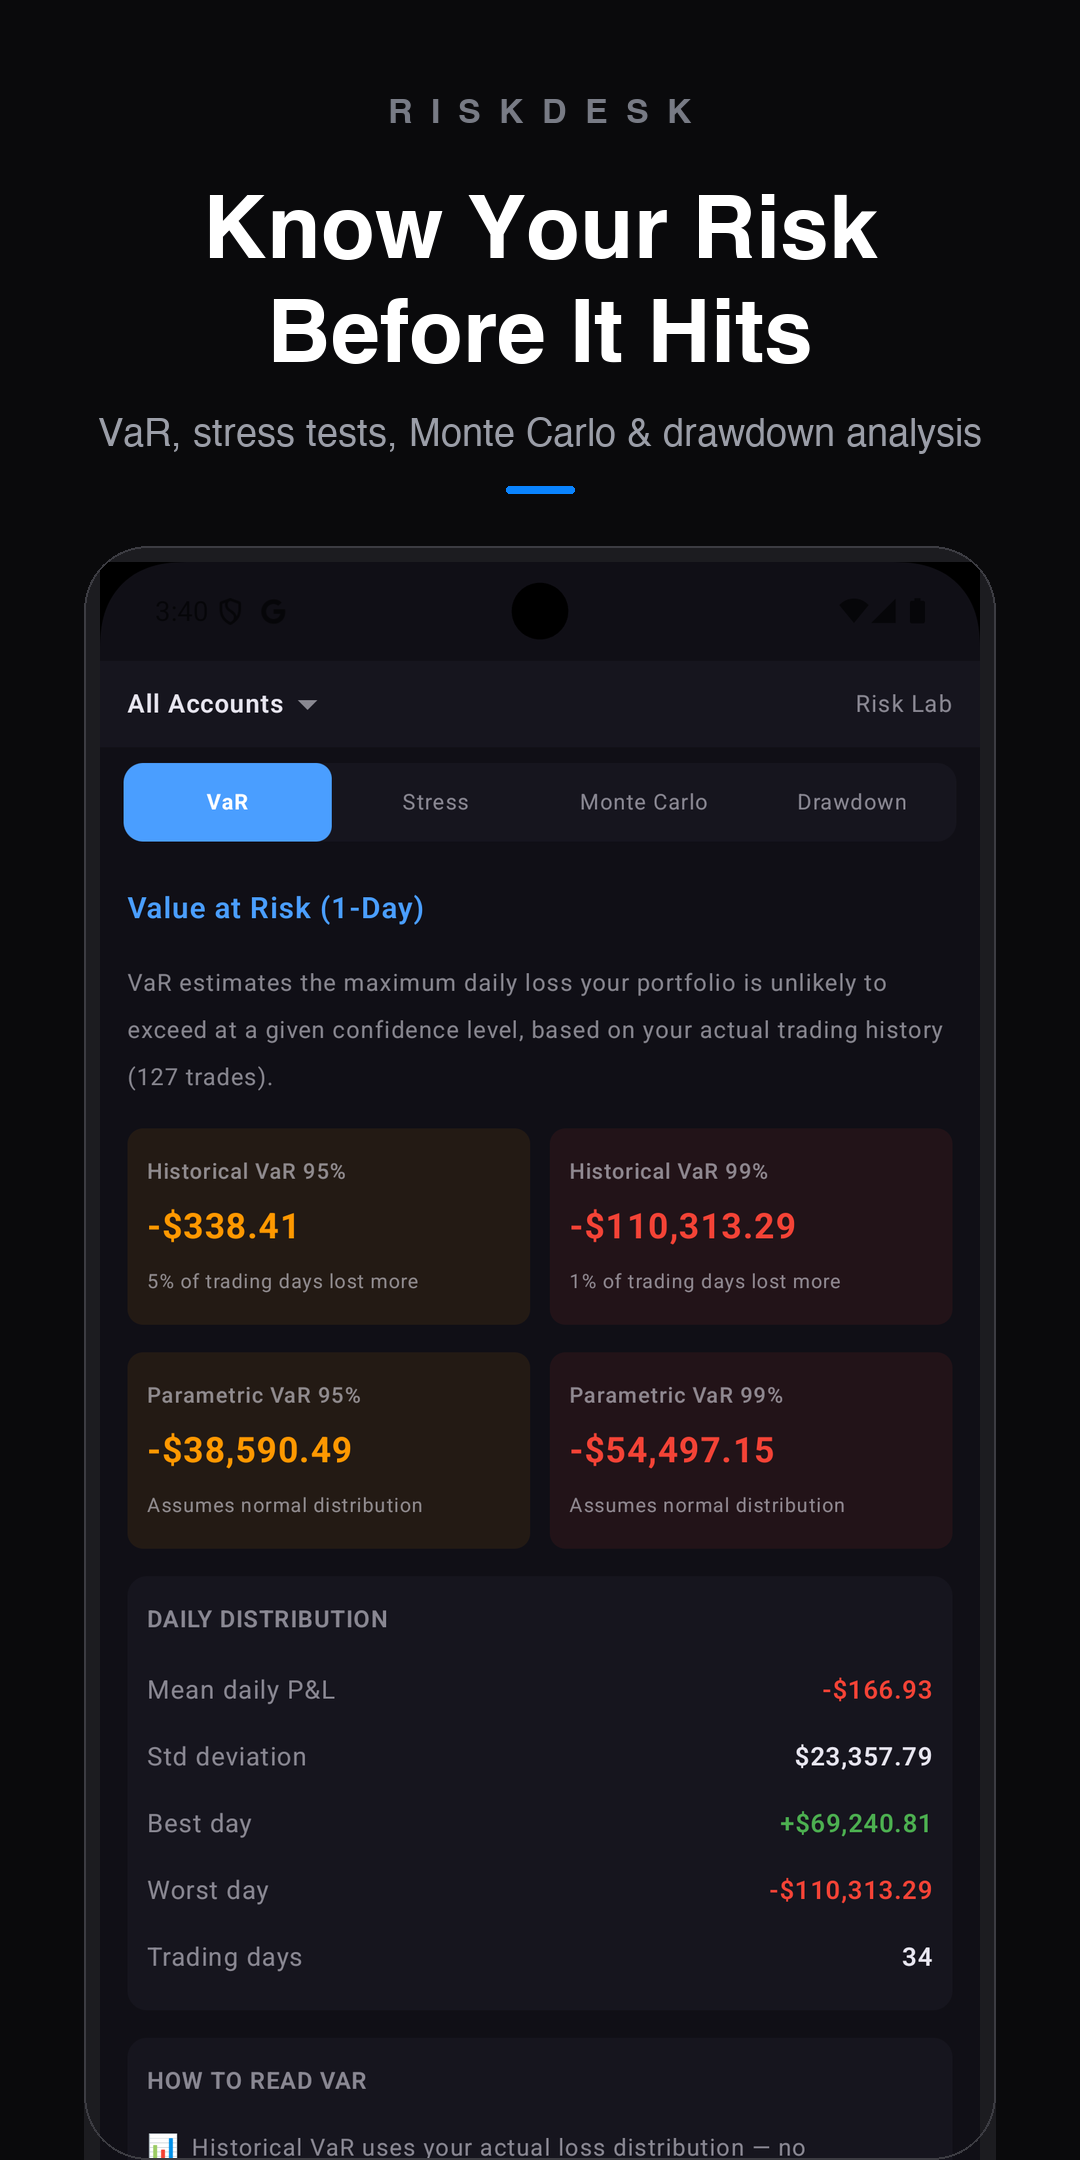
RiskDesk is now available on Google Play. Professional position sizing, ADR stop levels, performance analytics, and trade journaling — built for Android traders who size with edge.
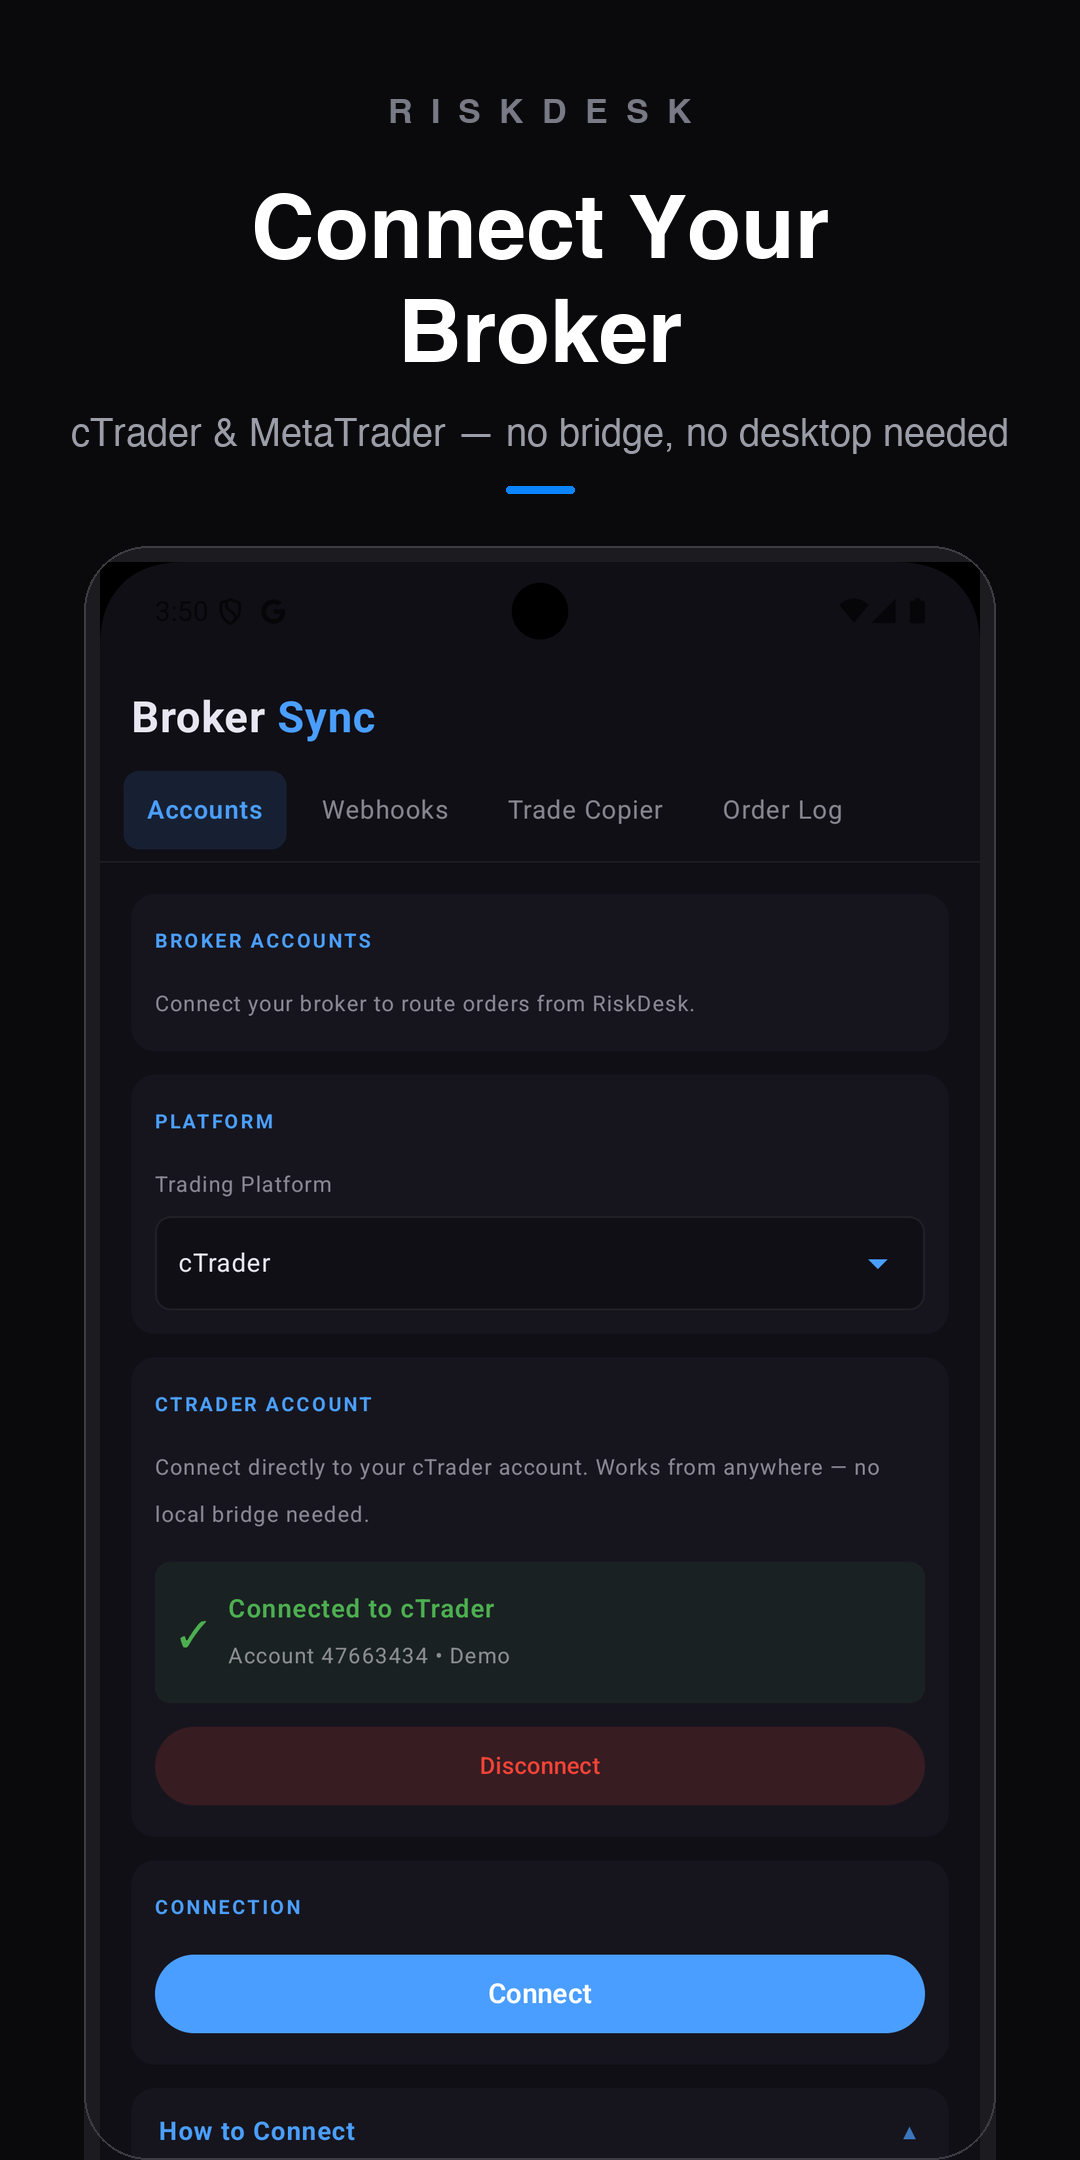
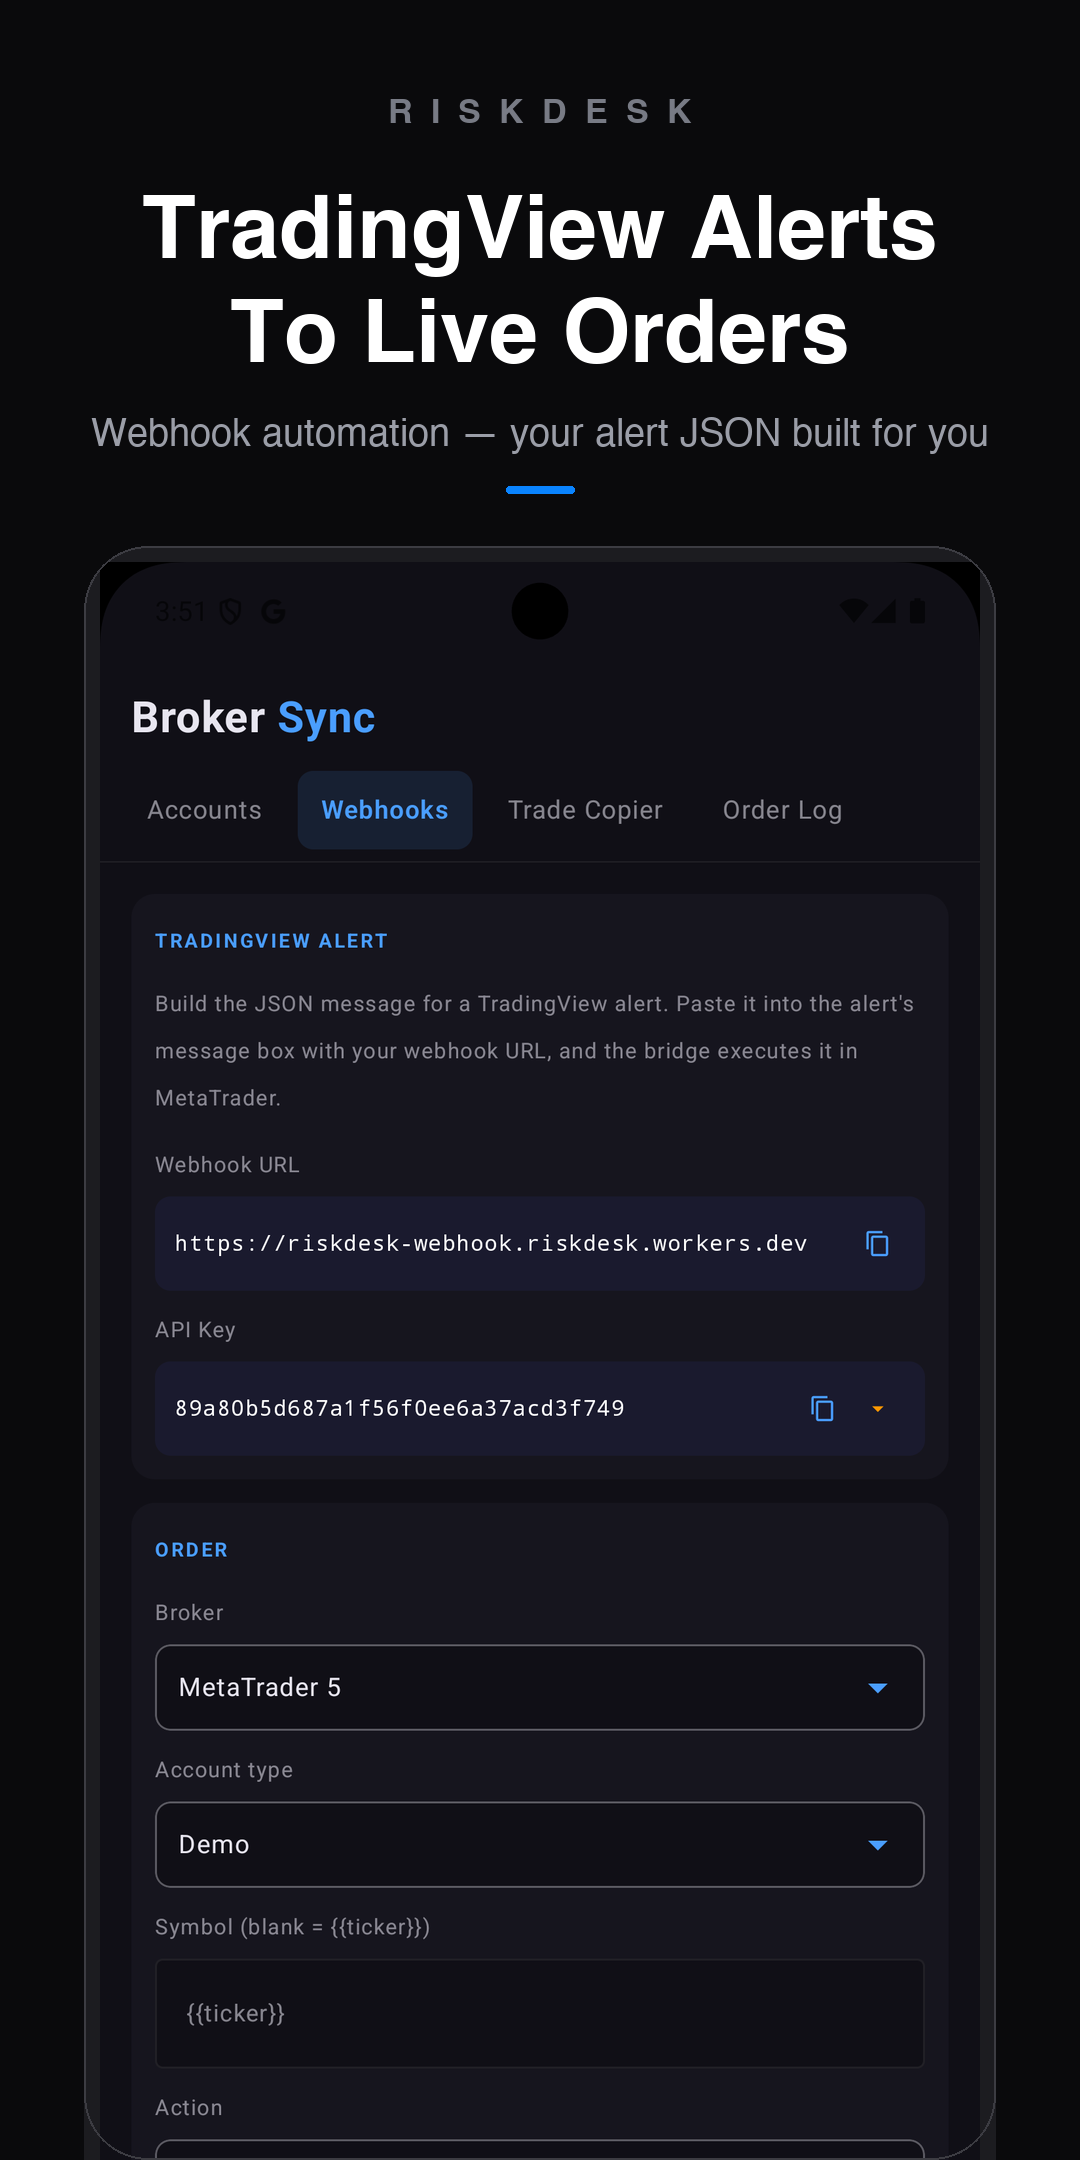
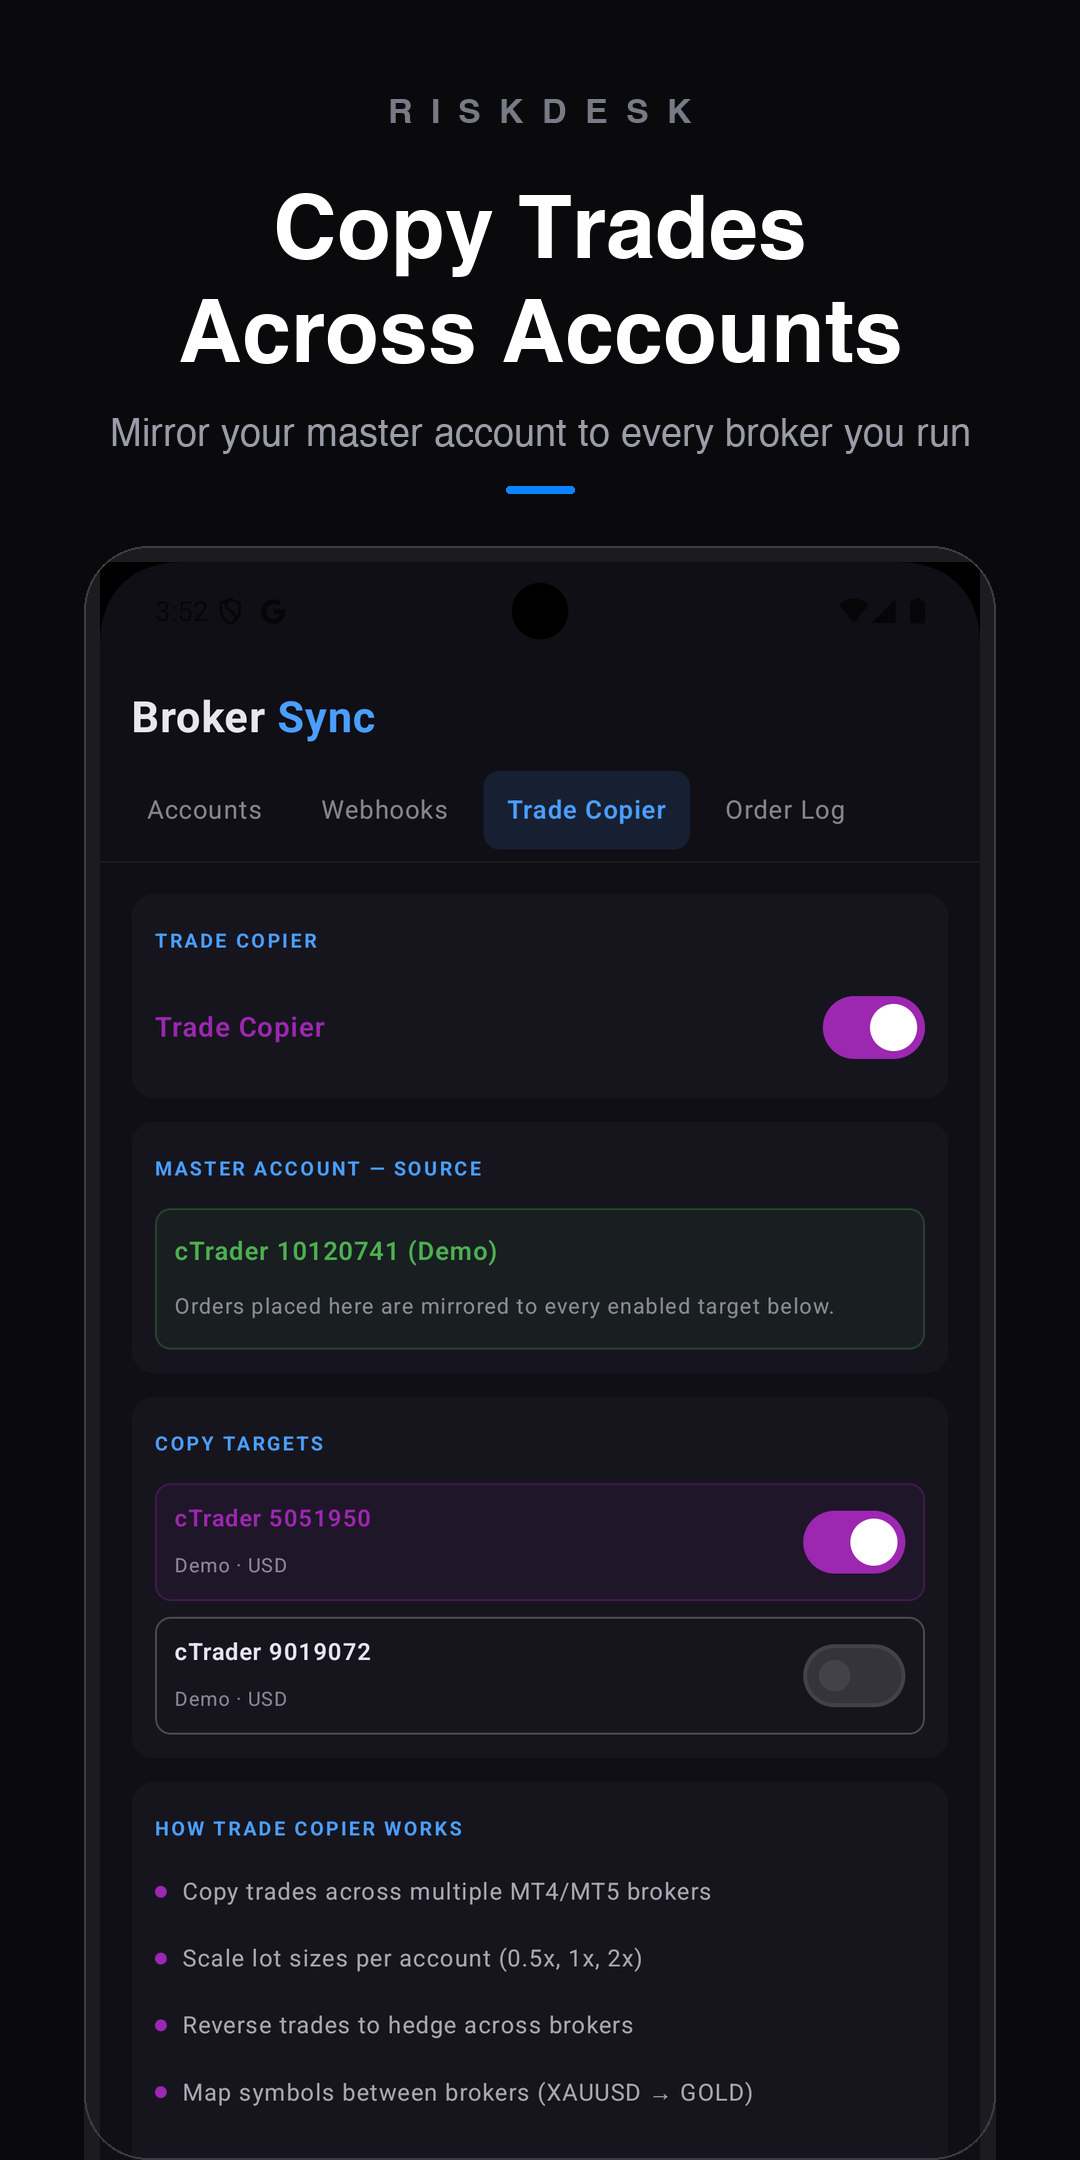
The RiskDesk Bridge is a NinjaTrader 8 add-on. It links the accounts you connect in NinjaTrader — including Tradovate and Rithmic prop firm logins — to RiskDesk on Mac, iPhone and Android.
You choose which accounts RiskDesk can see and which it can trade. Every entry is sent with its stop and target, and your prop limits are checked before each one.
 Accounts & Permissions
 Copy Groups
 Prop Limits
Connect cTrader and MetaTrader directly, and NinjaTrader 8 — with its Tradovate and Rithmic logins — through the RiskDesk Bridge. Prop firm accounts on those platforms connect the same way.
















Platform availability per firm as listed by each firm, October 2026. Check your firm's rules on trade copiers and automation before using them. All names and logos are trademarks of their respective owners and are shown only to indicate compatibility. RiskDesk is not affiliated with, endorsed by or sponsored by any of them. NinjaTrader® is a registered trademark of NinjaTrader Group, LLC. No NinjaTrader company has any affiliation with the owner, developer, or provider of the products or services described herein, or any interest, ownership or otherwise, in any such product or service, or endorses, recommends or approves any such product or service.
Risk First. Always.
Risk Warning: Trading financial instruments involves substantial risk of loss and is not suitable for all investors. RiskDesk is a reference tool only and does not constitute financial advice. The ADR stop levels displayed are not a guarantee that markets will not exceed your stop loss. You are solely responsible for all trading decisions and their outcomes. Past performance is not indicative of future results. Do not trade with funds you cannot afford to lose. Contact us for support.